 Chrome Extension
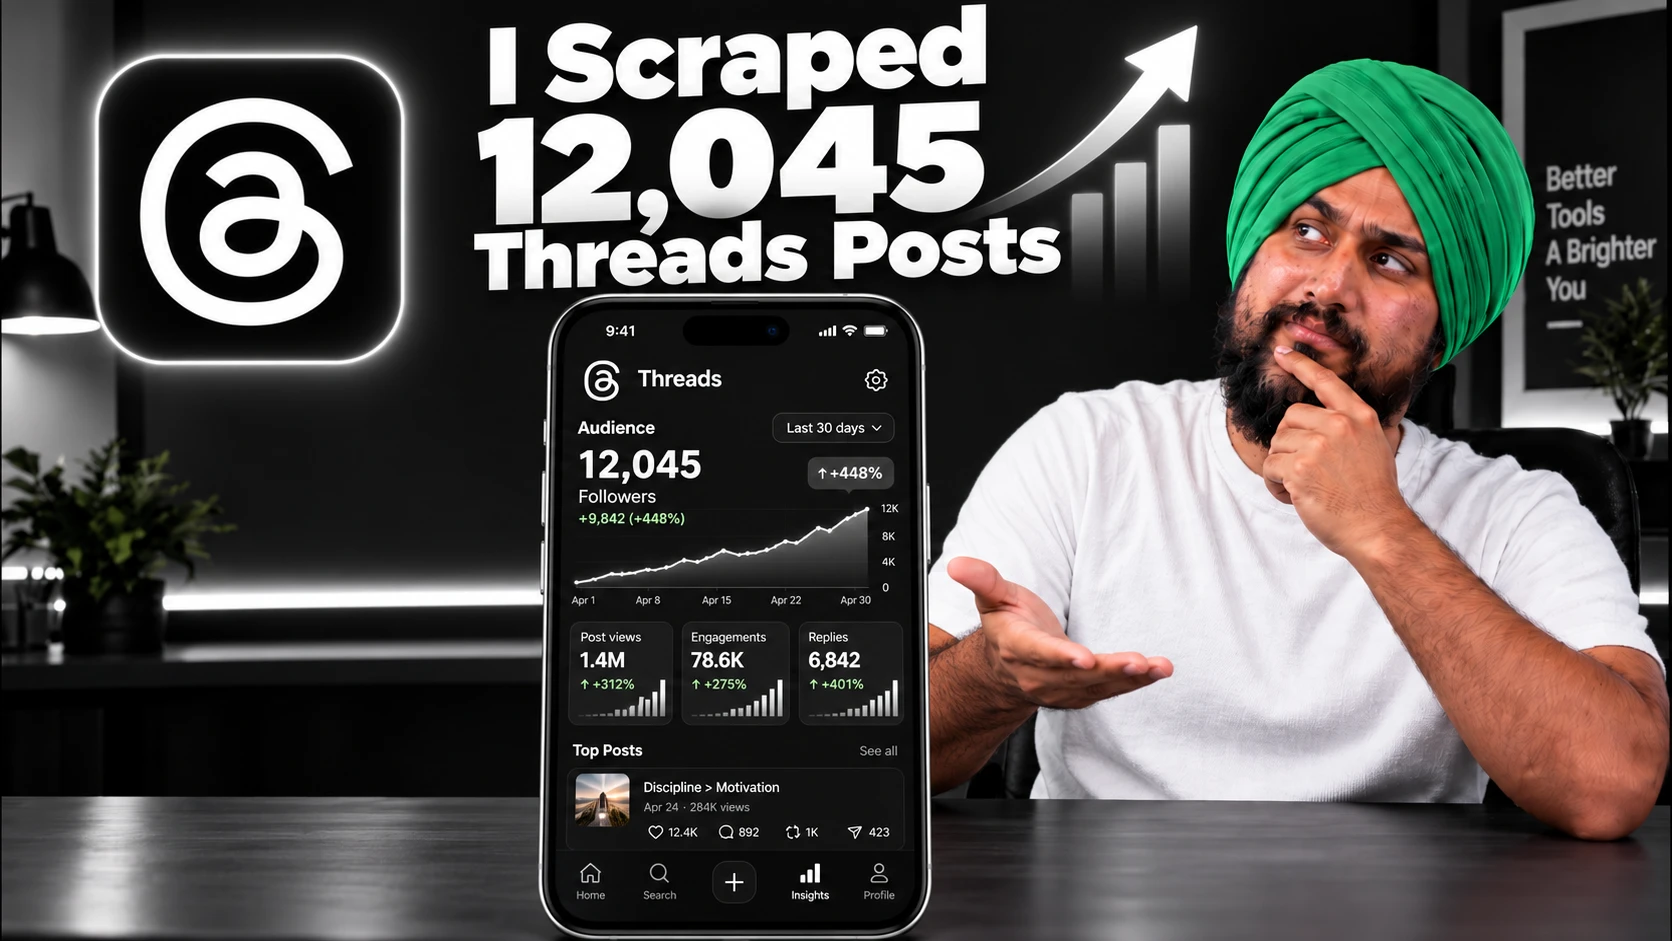
I scraped 12,045 Threads posts from 9,922 writers to find what went viral, and then I turned the data on my own August playbook. I took 35 claims about hooks, formats and timing and tested every claim against the same posts. Nearly half did not survive: 10 were not shown and 6 were wrong. A few findings did, and they are simple enough to use today.
In this guide you get every chart from my report with a plain explanation, my own Threads Insights for the last 30 days, two cheatsheets (one for a new profile, one for an audit) and a prompt pack you can paste into ChatGPT or Claude.
Previously : I Studied 21,864 Viral X Tweets to Find What Works (Research)
Key Takeaways
Why I Tested My Own Threads Advice
In August 2026 I wrote a "Threads Virality Teardown" research paper. It had a checklist of 30 items, a list of 100 hooks and a 90-day road plan.
The teardown was built on pooled data. It looked at all posts together and asked which ones earned more likes. That method has a famous flaw, and I will show you exactly where it breaks in a moment.
So I put my own advice on trial. My new report grades the teardown claim by claim, and nine AI refuter agents tried to break each finding. It replaces the 77-page study I wrote in August on the same data.
I publish under the Promptslove name, and prompt giveaway posts came in below the median in my data. I printed that result anyway. You deserve the version of the data that is true, not the version that flatters my work.
If you want the full report, it lives at promptslove.com.
Download Research Paper;
Threads-Virality-Research-Report-Promptslove.pdf
659 KB
How I Scraped and Checked 12,045 Threads Posts
Here is the collection process in one picture.
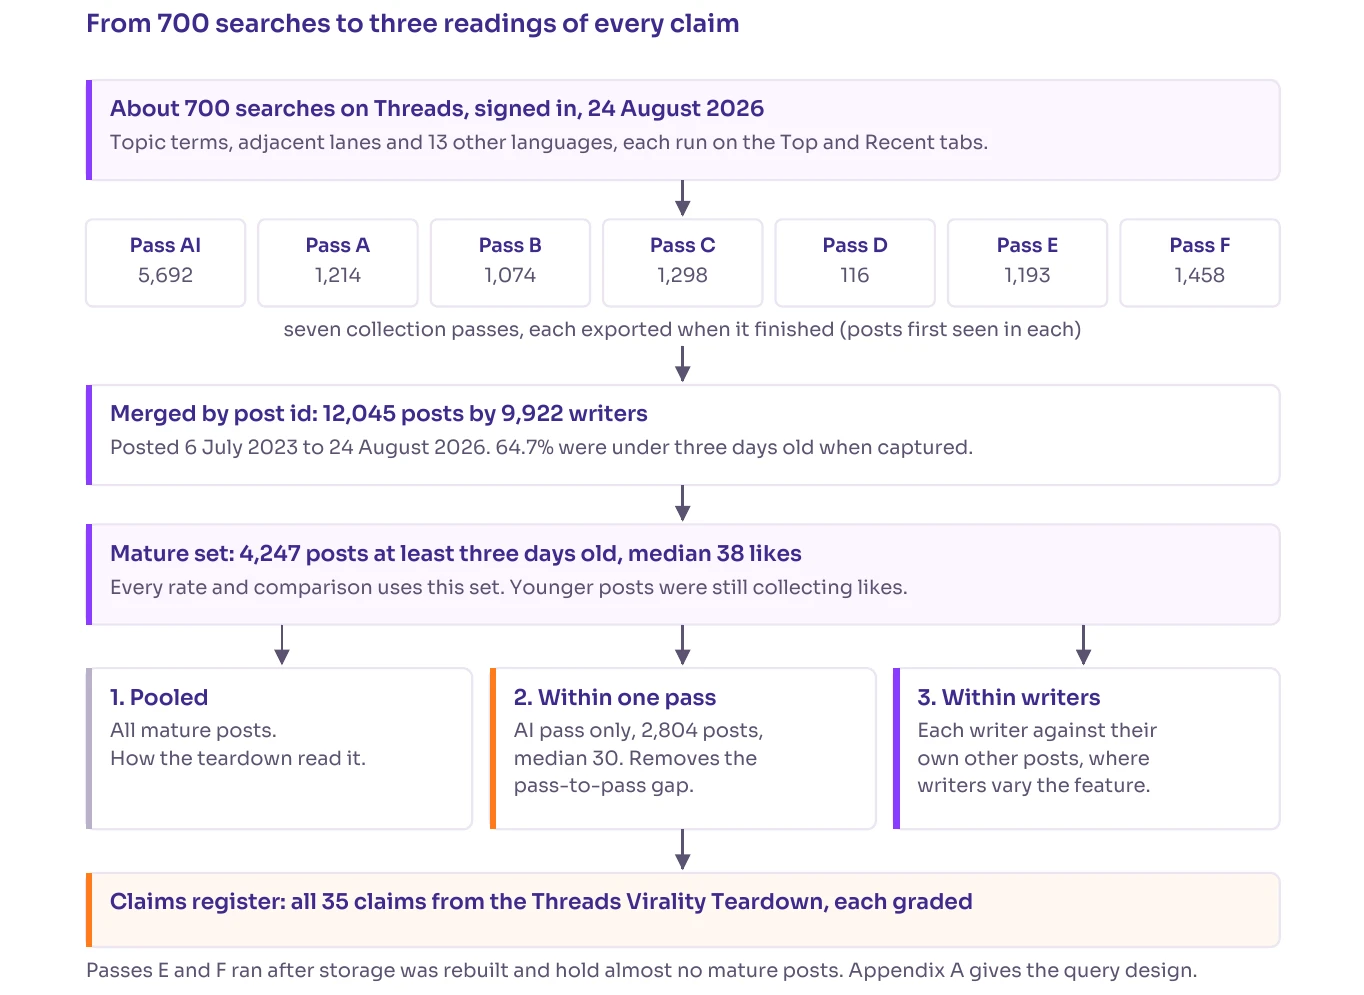
I ran about 700 searches on 24 August 2026 from a signed-in browser session. The search terms covered AI and technology topics, named tools and models, adjacent lanes such as design, marketing, careers and study, general interest topics, and the same ideas in 13 other languages. I ran each search on both the Top and Recent tabs, and a script in the page kept every post object that carried a post ID and a like count.
The searches ran in seven passes. I merged them by post ID and got 12,045 posts from 9,922 writers. The posts date from 6 July 2023 to 24 August 2026, and 64.7% were under three days old when I captured them.
The Mature Set
Posts keep collecting likes for days. A post that is six hours old looks weak even if it will do well tomorrow. So every like comparison in my report uses only the 4,247 posts that were at least three full days old. Their median is 38 likes (95% CI 34 to 42).
That median is my yardstick for the rest of this article. When I say "1.5 times the median", I mean 1.5 times 38 likes.
The Three Readings of Every Claim
I read each claim three ways. This table is the key to everything below.
| Reading | What I compared | What it removes | Weakness |
|---|---|---|---|
| Pooled | All mature posts with a feature against all without it | Nothing. This is how my August teardown worked | Good writers use certain tricks, so the trick gets the credit |
| Within one pass | The same comparison inside the largest search pass (2,804 posts, median 30 likes) | Differences between search passes | Still mixes writers |
| Within writers | Each writer's posts with the feature against that same writer's other posts | Everything stable about the writer: audience, topic, style | Needs writers who post both ways, and a writer may choose when to use a trick |
The third reading is the fair test. Here is how it works. Take a writer who posted both image posts and text posts. Divide the median likes of their image posts by the median likes of their text posts. Do that for every writer who did both, then take the median of those ratios. I add 1 to each median so nobody divides by zero, which pulls every ratio toward 1 and makes the test cautious.
I measured the uncertainty with a bootstrap confidence interval (2,000 resamples). I also applied the Benjamini-Hochberg correction, which limits how often a pile of tests hands you a false win. Run dozens of tests and a few will look significant by luck.
Why the Pooled View Misleads You
The pooled view runs into Simpson's paradox: a pattern in the combined data can shrink or flip once you split the data into groups. On Threads, the groups are writers. A writer with 500,000 followers gets more likes on everything, and if that writer also loves bullet lists, bullet lists look powerful.
Researchers who study wording on social media use the same fix. A 2014 study of tweets compared pairs of tweets from the same author about the same link, and found that wording matters, though only modestly. My Threads result is blunter: once I held the writer fixed, I could not measure an opener effect at all.
I should be fair to the pooled view too. It is how most Threads advice is built, and it does describe what you see in your feed. It just does not tell you what to do.
Viral on Threads Is a Lottery With Very Few Winners
Start with the shape of the data, because it changes how you should feel about your own numbers
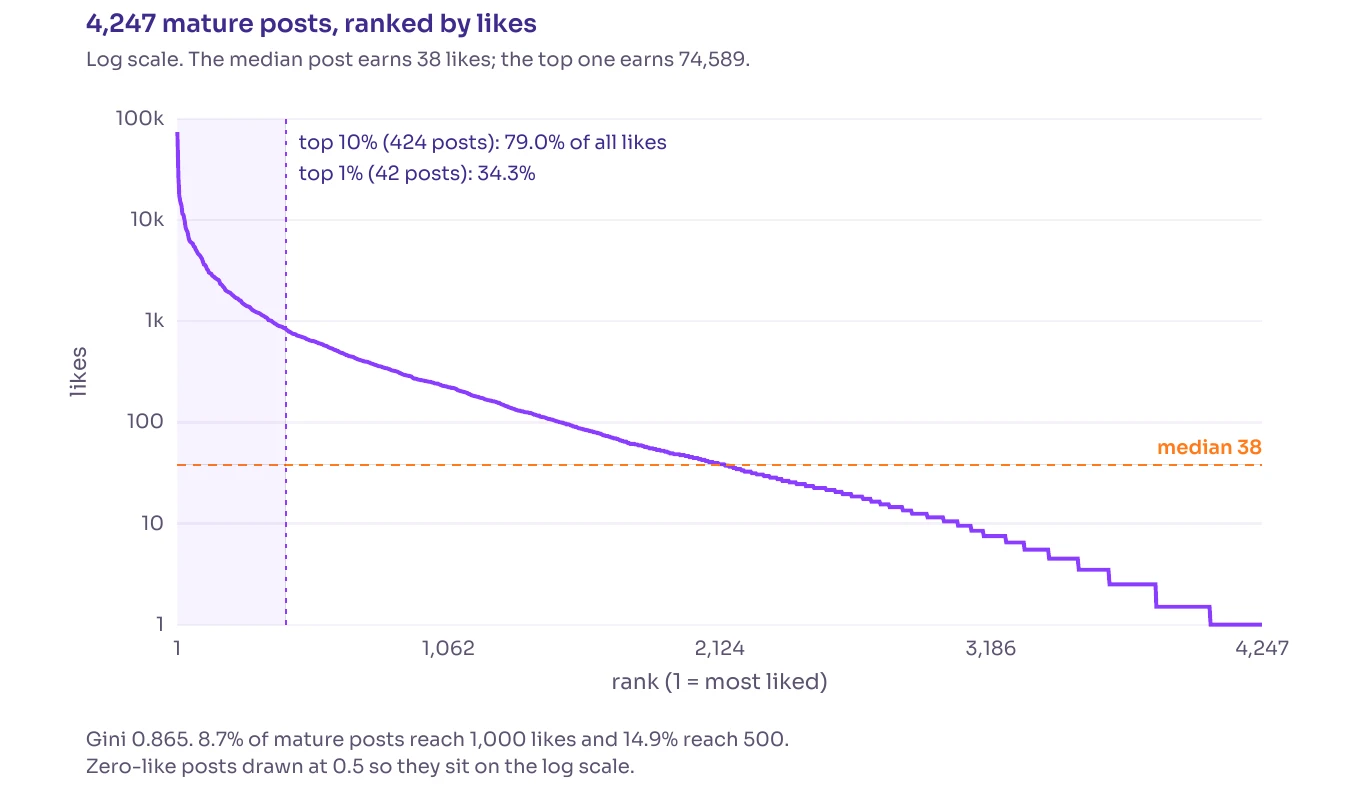
How to read it: every post sits on the line, from the most liked on the left to the least liked on the right. The vertical axis is a log scale, so each gridline is ten times higher than the one below it. The shaded band on the left is the top 10% of posts.
The line falls off a cliff. The top post earned 74,589 likes and the median post earned 38.
| Measure | Value |
|---|---|
| Median likes (95% CI) | 38 (34 to 42) |
| Mean likes | 456.3 |
| 90th percentile | 842 |
| 99th percentile | 6,899 |
| Most liked mature post | 74,589 |
| Share of posts reaching 500 likes | 14.9% |
| Share of posts reaching 1,000 likes | 8.7% (371 posts) |
| Share of all likes held by the top 1% of posts | 34.3% |
| Share of all likes held by the top 10% of posts | 79.0% |
| Gini coefficient | 0.865 |
The mean is 12 times the median. One post with 74,589 likes moves a group's mean more than any writing effect in my report, so I used medians for every comparison. You should do the same with your own account.
A Gini of 0.865 means likes sit with a small share of posts. A score of 0 would mean every post earned the same.
The Same Shape Shows Up Across Writers
The concentration is even sharper when you group likes by writer.
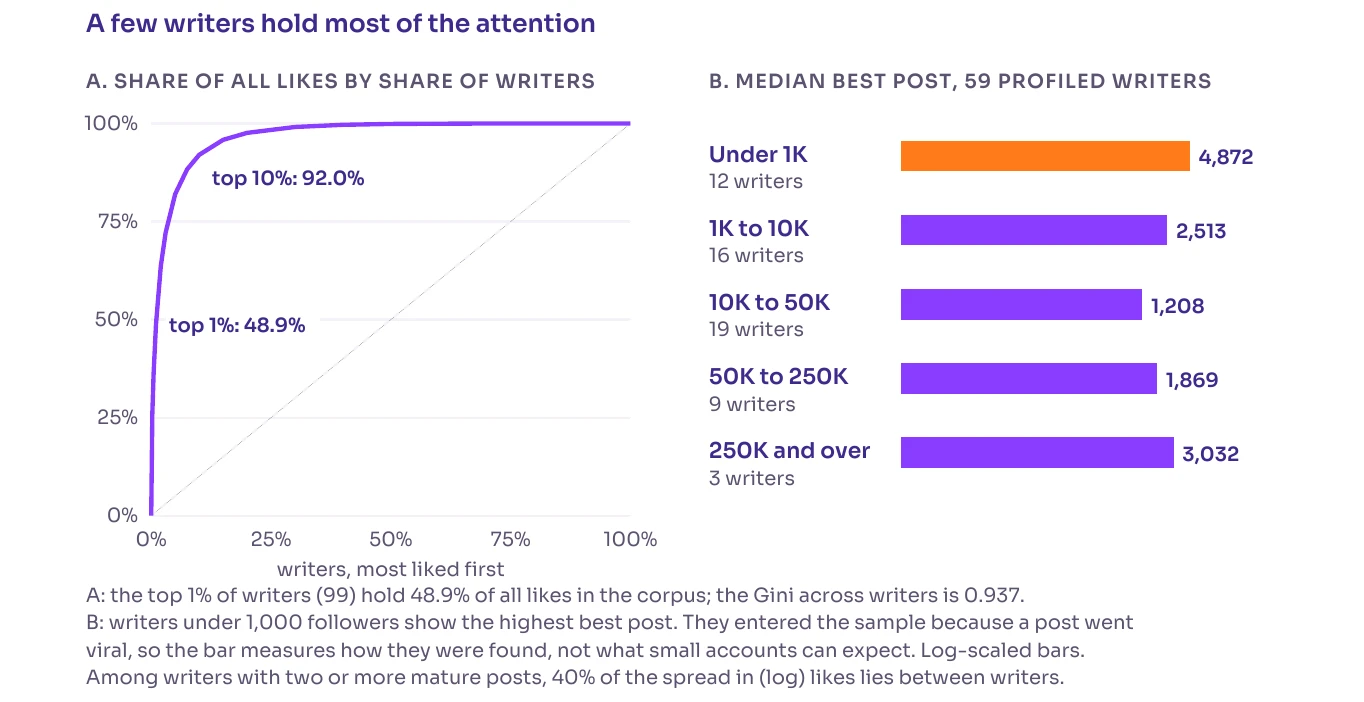
Panel A is a concentration curve. The top 1% of writers (99 of 9,922) hold 48.9% of all likes, and the top 10% hold 92%. The Gini across writers is 0.937.
This is a familiar pattern online. In an experiment with an artificial music market, researchers found that the more people could see what others chose, the more unequal and unpredictable the winners became. Threads shows likes on every post, so a similar dynamic is plausible here.
I will come back to panel B in the creators section, because it hides a trap.
Two Traps That Fool Most Threads Studies
Two problems sit underneath every result in this article, and they apply to any Threads study you read.
Trap 1: Which Search Found the Post
I ran the same search method in seven passes. Five passes had enough mature posts to compare.
Each dot is a pass. The dashed line is the 38-like median of all mature posts. Pass A sits at 20 likes and Pass D sits at 331.5, a gap of 16.6 times.
Same method, same platform, same day. The difference comes from what each search term surfaced. A comparison that mixes passes partly measures which search found the post. That is why my second reading stays inside the largest pass.
If you use any tool that "finds viral posts" by searching, ask what the search itself selects for.
Trap 2: Old Posts Are Survivors
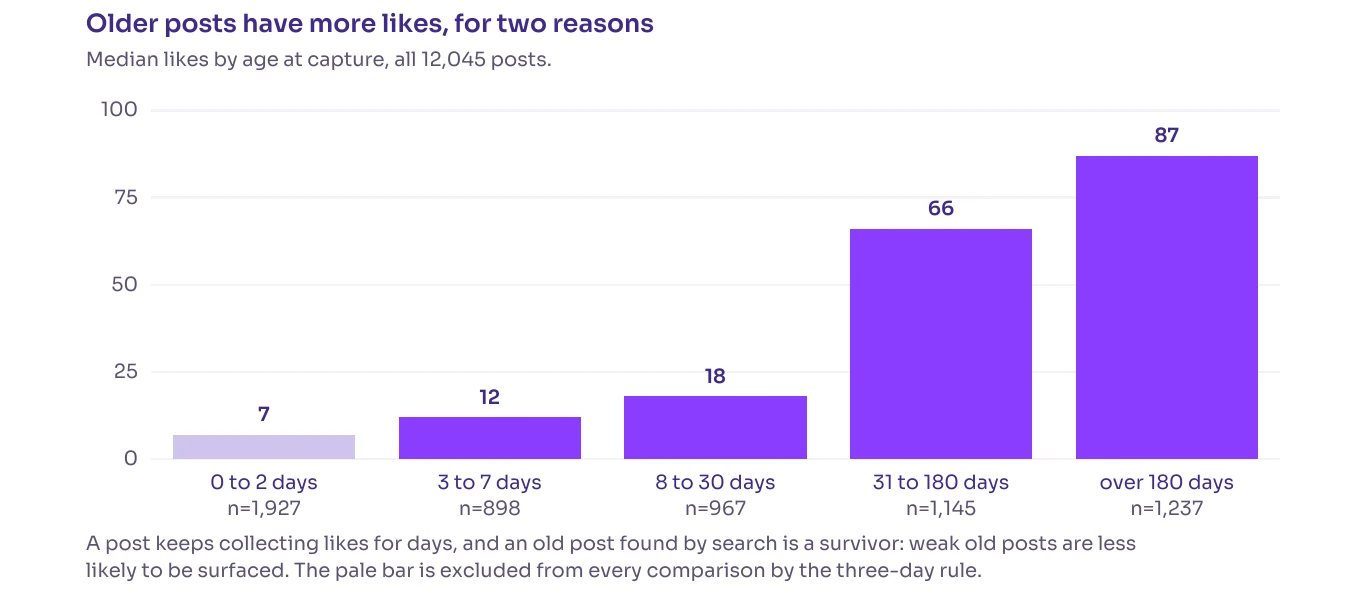
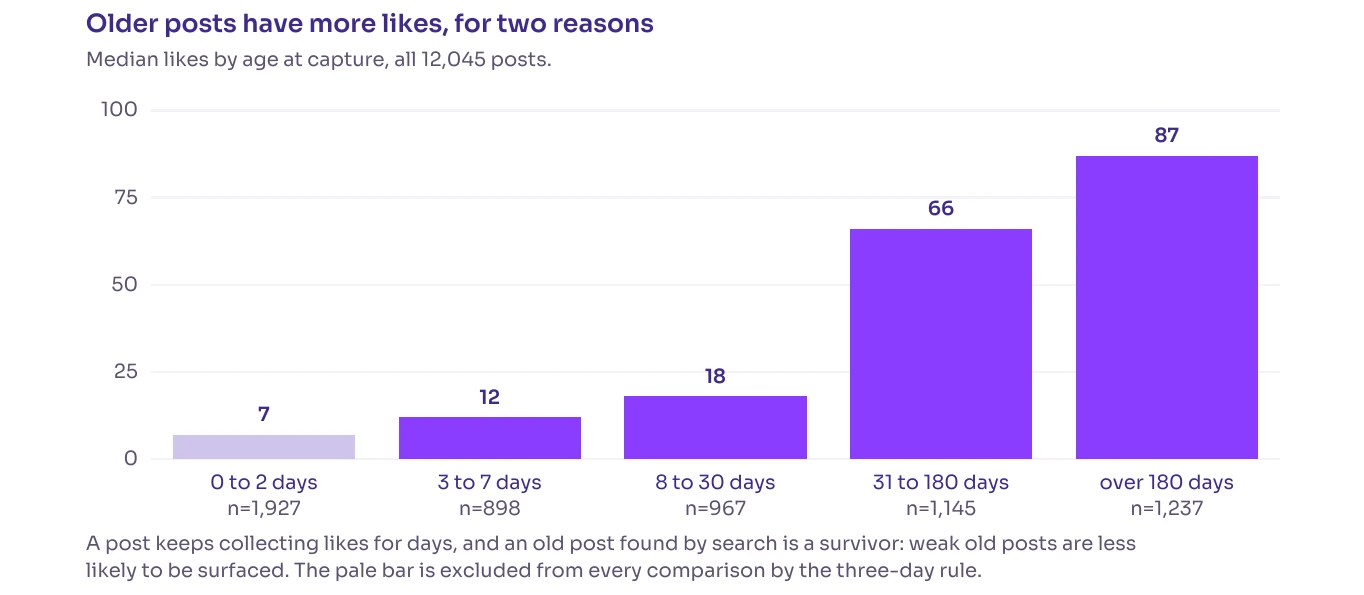
The bars climb with age: 7, 12, 18, 66 and 87 likes. The pale first bar is the group I excluded from every comparison.
There are two reasons the bars climb. Posts keep collecting likes for days. And an old post that search still surfaces is a survivor, because weak old posts are less likely to be surfaced at all.
If a "study" tells you older posts do better, or compares posts of mixed ages without saying so, be skeptical until it explains how it handled age.
Post Types: Strong Pooled, Flat Within Writers
My August teardown said news posts, listicles and tutorials were "the reliable formats to build a habit on". Here is what each type looks like read three ways.
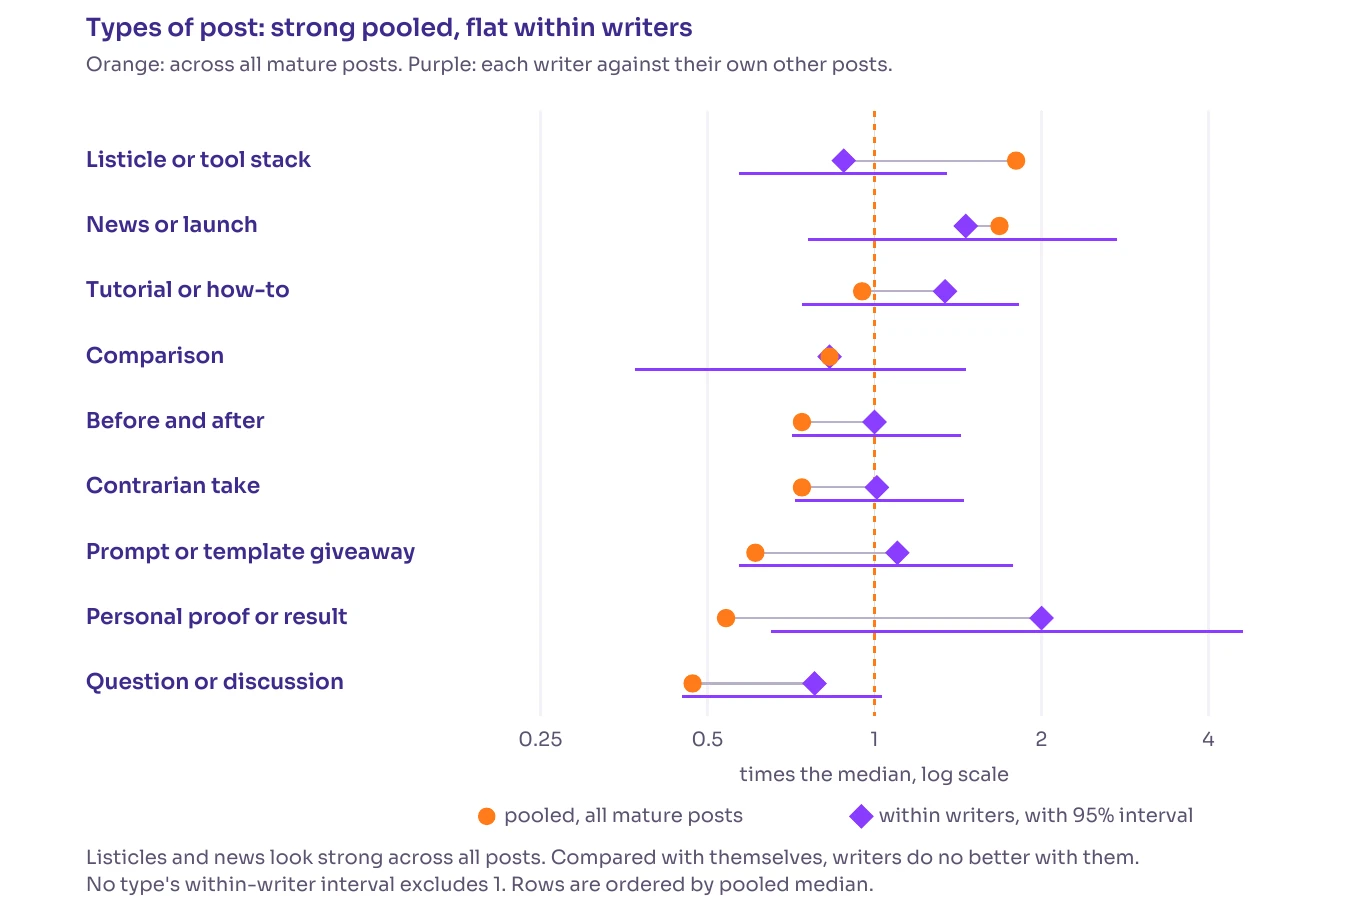
Orange dots are the pooled reading, where 1 equals the median. Purple diamonds are the within-writer reading, with a 95% interval as the line. Whenever an interval crosses 1, I cannot rule out "no effect".
Listicles and tool stacks look great pooled (1.8 times the median). Inside one writer's own posts the ratio is 0.88. Every purple interval crosses 1.
| Type of post | Posts | Median likes | Pooled lift | Within writers (95% CI) |
|---|---|---|---|---|
| Listicle or tool stack | 520 | 68.5 | 1.80 | 0.88 (0.57 to 1.35) |
| News or launch | 88 | 64 | 1.68 | 1.46 (0.76 to 2.74) |
| Tutorial or how-to | 183 | 36 | 0.95 | 1.34 (0.74 to 1.82) |
| Comparison | 92 | 31.5 | 0.83 | 0.83 (0.37 to 1.46) |
| Before and after | 279 | 28 | 0.74 | 1.00 (0.71 to 1.43) |
| Contrarian take | 413 | 28 | 0.74 | 1.01 (0.72 to 1.45) |
| Prompt or template giveaway | 293 | 23 | 0.61 | 1.10 (0.57 to 1.78) |
| Personal proof or result | 98 | 20.5 | 0.54 | 2.00 (0.65 to 4.62) |
| Question or discussion | 845 | 18 | 0.47 | 0.78 (0.45 to 1.03) |
Look at personal proof posts. Pooled, they sit at 0.54. Within writers, they hit 2.0, but the interval runs from 0.65 to 4.62 on only 98 posts. That is a signal worth watching and not a result worth building on.
News posts lean up in both readings, but the interval is wide. So the honest verdict is "might help, not shown".
The "Lottery Format" Idea Was Wrong
My teardown admitted that contrarian takes and personal stories had low medians. It argued you should post them anyway, because they have the highest chance of breaking out. That claim is testable, so I tested it: what share of each type reaches 1,000 likes?
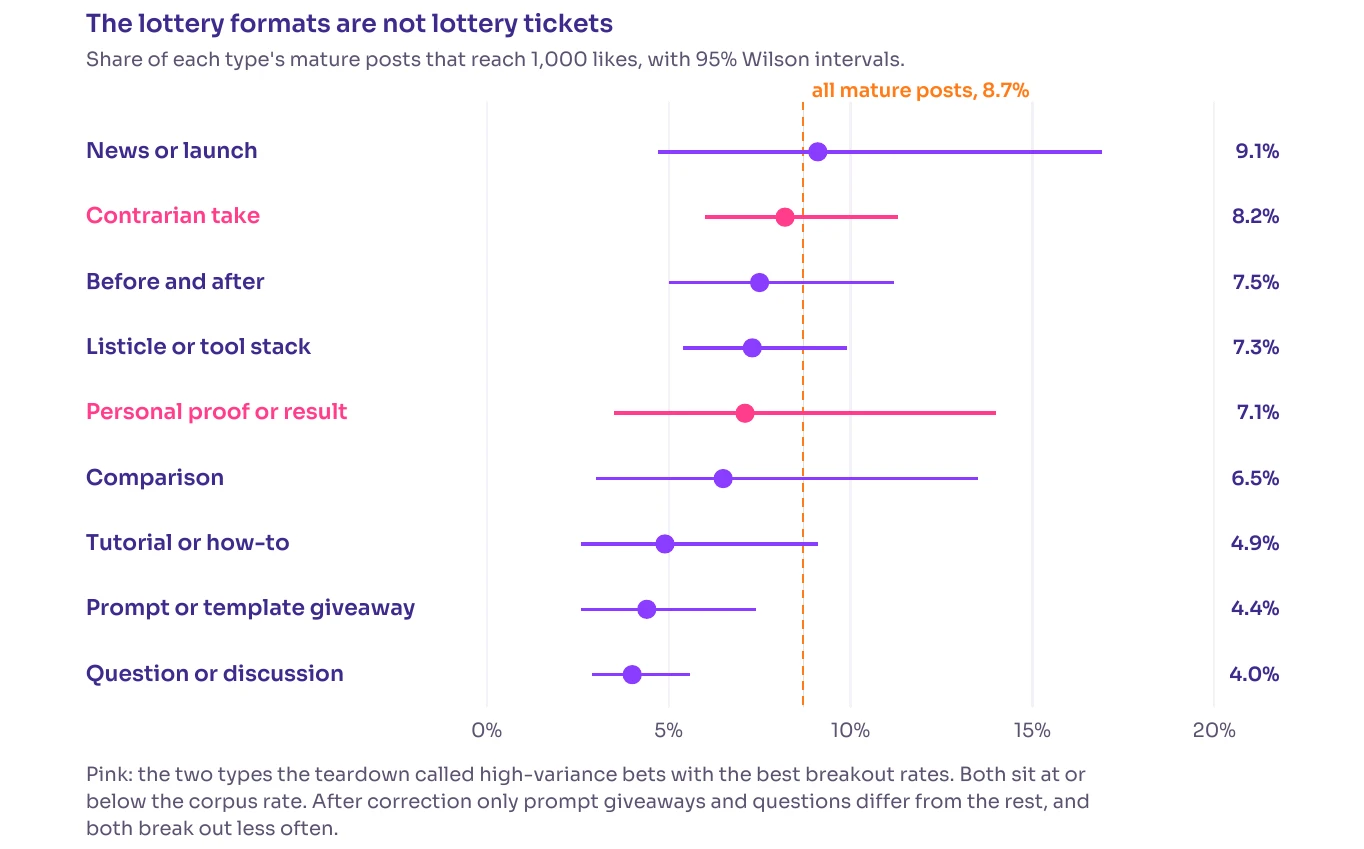
The dashed line is the 8.7% breakout rate for all mature posts. The two pink rows are the types my teardown called high-variance bets.
Contrarian takes broke out 8.2% of the time and personal proof 7.1%. Every other post broke out 8.8% of the time. Those two types were no better tickets than an ordinary post. Their rates sit slightly below it, though not by a margin I can tell apart from chance.
After correction, only two types differ from the rest, and both break out less often:
There are no lottery formats in this corpus. The types I recommended for breakout attempts break out no more often than anything else.
What Your Post Is About Is the Biggest Lever I Measured
If writing style barely matters, what does? Subject.
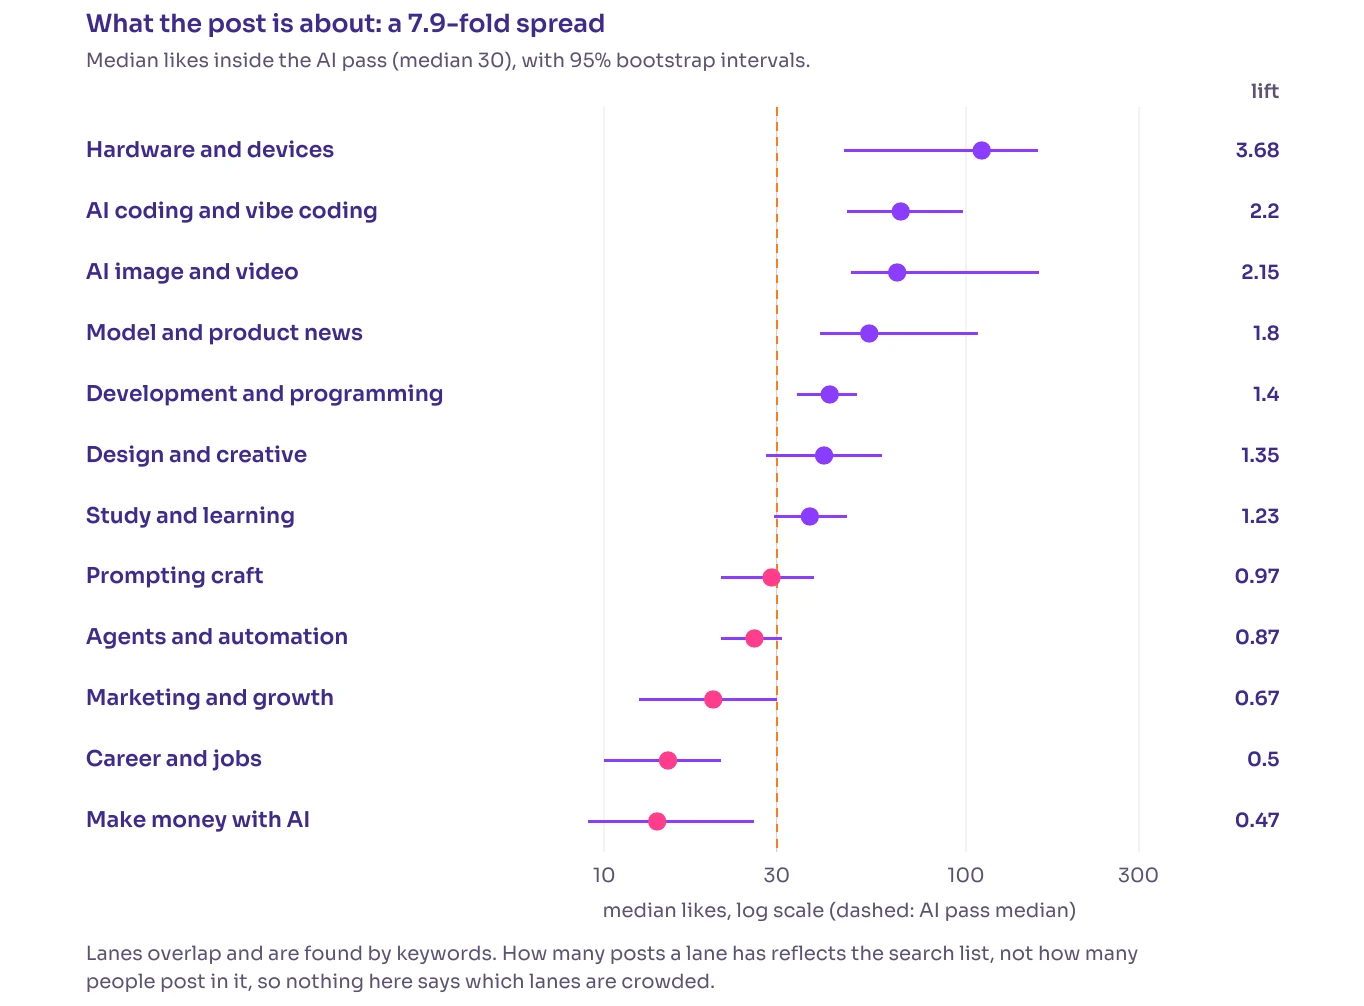
I scored twelve lanes inside the AI pass, where every post surfaced in the same collection pass. Hardware and devices earned a median of 110.5 likes. Making money with AI earned 14. The spread from top to bottom is 7.9 times, larger than any writing effect in my report.
| Lane | Posts | Median likes | Lift vs AI-pass median |
|---|---|---|---|
| Hardware and devices | 52 | 110.5 | 3.68 |
| AI coding and vibe coding | 161 | 66 | 2.20 |
| AI image and video | 116 | 64.5 | 2.15 |
| Model and product news | 164 | 54 | 1.80 |
| Development and programming | 393 | 42 | 1.40 |
| Design and creative | 268 | 40.5 | 1.35 |
| Study and learning | 272 | 37 | 1.23 |
| Prompting craft | 398 | 29 | 0.97 |
| Agents and automation | 319 | 26 | 0.87 |
| Marketing and growth | 180 | 20 | 0.67 |
| Career and jobs | 147 | 15 | 0.50 |
| Make money with AI | 185 | 14 | 0.47 |
The pattern is easy to see once you look for it. Lanes where a post can show something, a device, a screen of code or a generated image, lead the table. Lanes that can only describe a method or promise an outcome sit at the bottom.
Topics Read Three Ways
I also tested the topic definitions from my teardown. Only one topic beat the same writer's other posts after correction.
| Topic | Posts | Pooled lift | Within writers (95% CI) | Survives correction? |
|---|---|---|---|---|
| Gemini, NotebookLM, Nano Banana | 125 | 2.37 | 1.76 (1.0 to 11.69) | No |
| AI image and video | 80 | 1.45 | 1.38 (1.0 to 3.1) | No |
| Claude and Anthropic | 321 | 1.32 | 1.00 (0.91 to 1.57) | No |
| AI coding | 355 | 1.08 | 1.34 (1.07 to 2.12) | Yes (adjusted p = 0.012) |
| Prompting craft | 250 | 0.71 | 1.16 (0.5 to 3.34) | No |
| Agents and automation | 270 | 0.67 | 1.33 (0.91 to 2.03) | No |
| ChatGPT and OpenAI | 406 | 0.67 | 1.79 (1.0 to 3.73) | No |
| Jobs and careers | 190 | 0.49 | 1.37 (0.95 to 5.15) | No |
| Make money with AI | 99 | 0.26 | 1.00 (0.31 to 2.01) | No |
AI coding is odd. Pooled, it sits at 1.08, which is nothing. Within writers it earns 1.34 times the same writer's other posts across 74 writers. So when a writer switches to a coding post, that post tends to do better than their usual.
"Make money with AI" is the worst topic in the pooled and within-pass readings, and it is flat within writers. Part of its penalty is who writes about it, not the topic alone.
One caution on lane sizes. How many posts a lane has in my data reflects how often I searched for it, so my data cannot tell you which lanes are crowded.
Openers, Formatting and Calls to Action: Where My Hook Advice Fell Apart
My teardown gave firm rules for the first line. It told you to open with a command, a contrarian claim, a reveal or news. It said never to open on a question, to name the tool or number in the first six words, and to keep the first line under about 80 characters.
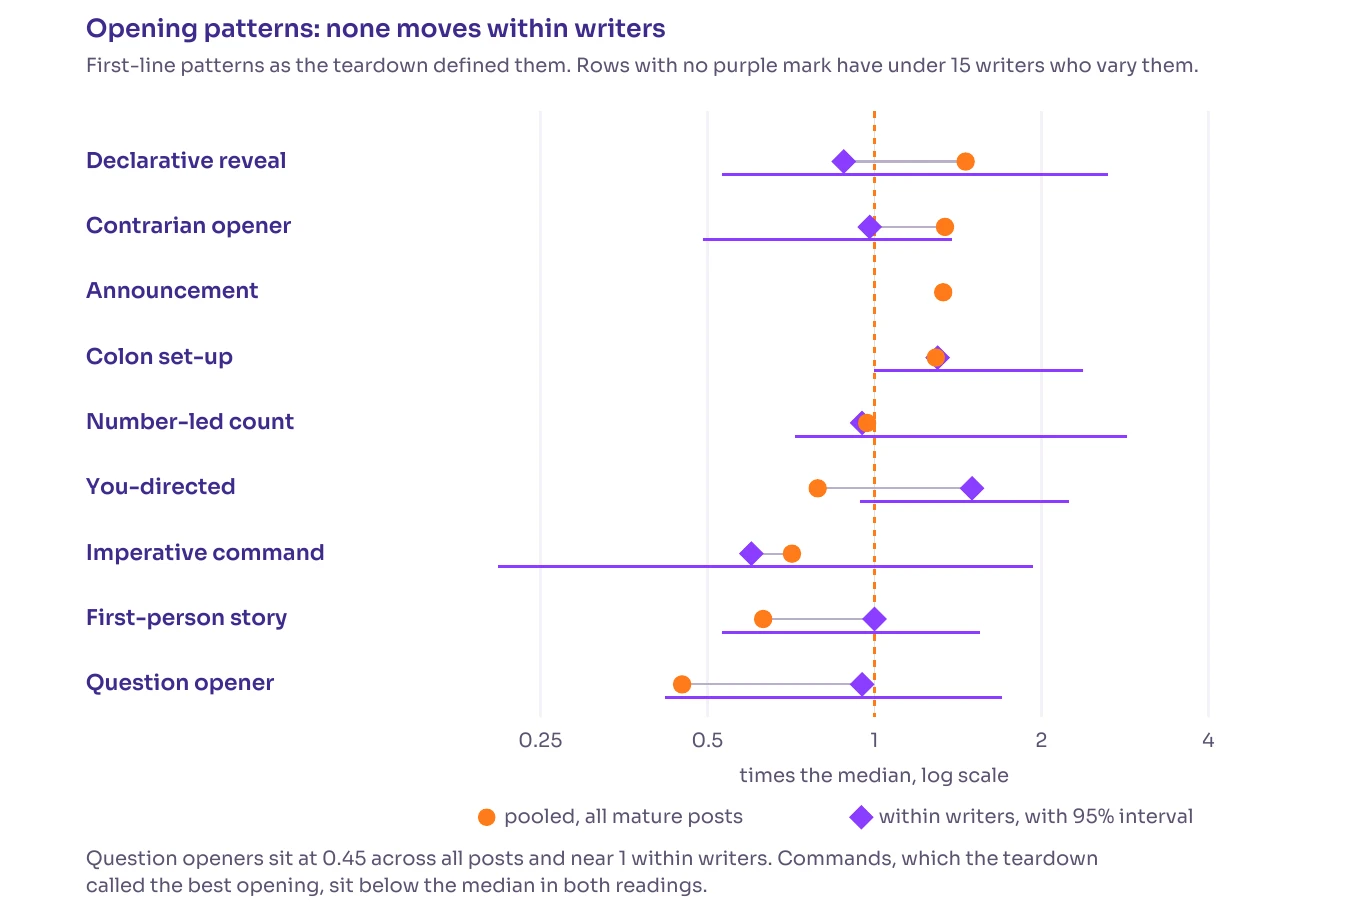
Same layout as before. Orange is pooled, purple is within writers, and 1 means "no different from the median". Rows with no purple mark have fewer than 15 writers who vary that pattern.
Question openers sit at 0.45 pooled, which looks like a disaster. Within writers they sit at 0.95. Most of the pooled gap looks like a writer effect, not a question-mark effect.
Commands, which I called the best opening, sit below the median in both readings.
| Opening pattern (first line only) | Posts | Pooled lift | Within writers (95% CI) |
|---|---|---|---|
| Declarative reveal ("This is...", "Here's...") | 66 | 1.46 | 0.88 (0.53 to 2.64) |
| Contrarian opener | 72 | 1.34 | 0.98 (0.49 to 1.38) |
| Announcement ("Breaking", "Just", "New") | 46 | 1.33 | 13 writers, too few to test |
| Colon set-up (a line ending in a colon) | 222 | 1.29 | 1.30 (1.0 to 2.38) |
| Number-led count | 52 | 0.97 | 0.95 (0.72 to 2.85) |
| You-directed | 137 | 0.79 | 1.50 (0.94 to 2.24) |
| Imperative command | 64 | 0.71 | 0.60 (0.21 to 1.93) |
| First-person story | 263 | 0.63 | 1.00 (0.53 to 1.55) |
| Question opener | 402 | 0.45 | 0.95 (0.42 to 1.70) |
The closest thing to a winner is the colon set-up, a first line that promises a list and ends on a colon. It reaches 1.3 within writers with an interval that starts exactly at 1, and it does not pass correction.
I ran a tighter set of definitions in a separate 23-tactic battery (more on that below) and got the same answer:
Within writers, no way of opening a post earns measurably more than another.
I want to be careful with that sentence. Tighter studies of the same author on the same topic do find that wording matters by modest amounts. What my data shows is narrower: the specific rules I gave you in August are not visible once the writer is held fixed, at this sample size.
Formatting and Calls to Action
The same thing happened with formatting and with "the ask".
| Feature | Posts | Pooled lift | Within writers (95% CI) |
|---|---|---|---|
| Numbered lines | 273 | 2.05 | 0.88 (0.44 to 1.35) |
| Bullet list | 169 | 1.53 | 0.80 (0.50 to 1.25) |
| Emoji | 1,560 | 1.03 | 0.94 (0.63 to 1.33) |
| Hashtags | 658 | 0.93 | 1.06 (0.76 to 1.63) |
| Arrow | 190 | 0.92 | 1.23 (0.89 to 2.25) |
| Ask for a follow | 98 | 1.04 | 1.04 (0.24 to 2.71) |
| "Save this" | 191 | 0.89 | 0.94 (0.25 to 1.70) |
| Comment-a-keyword | 56 | 0.71 | 12 writers, too few to test |
| Ask for a repost | 26 | 0.45 | 6 writers, too few to test |
| Ends on a question | 495 | 0.42 | 0.79 (0.41 to 1.33) |
| "Try this" or "copy this" | 45 | 0.34 | 9 writers, too few to test |
| "Link in bio" or "DM me" | 47 | 0.29 | 10 writers, too few to test |
Numbered lines look like they double your likes (2.05 pooled). Within the same writer they sit at 0.88. My August claim that bullet lists "double the median" turned out to be about 1.5 times pooled and nothing within writers.
Hashtags did nothing in any reading. My test counted captions that contain #words. Meta's own claim is about its topic tag feature, which is a different thing, so I cover that in the FAQs.
The 100 Hooks, Audited
My teardown's most copied section was a list of 100 hooks. I audited every one against the corpus.
| Check | Result |
|---|---|
| Hooks in the list | 100 |
| Taken from a real post, with its text and like count | 63 |
| Written as templates, with no source post | 37 |
| Sourced hooks I found again in the data | 62 |
| Sourced hooks whose like count matches the corpus exactly | 61 |
| Median likes of the sourced posts | 990.5 |
| Sourced posts that carried an image, carousel or video | 48 of 62 |
Two findings stand out. First, 37 of my 100 hooks had no source post. I wrote them to fit a family, and the list did not mark which were which. It should have.
Second, the real hooks mostly rode on pictures. Of the 62 sourced posts, 22 carried an image, 20 a carousel and 6 a video, and only 14 were plain text. Since media is the one tactic that holds within writers, some of what these hooks get credit for probably belongs to what was attached.
Here are the ten most-liked sourced hooks, described by pattern.
| Hook pattern (paraphrased) | Family | Likes | Format |
|---|---|---|---|
| "Don't use AI for [a creative act]" warning | Contrarian opener | 12,447 | Text |
| "Day 1" of a public experiment with a new model | First-person proof | 6,962 | Image |
| A flipped prediction about humans and AI | Contrarian opener | 6,315 | Text |
| A command to stop wasting time on random prompts | Imperative command | 5,922 | Video |
| "Apps you need to try", part 4 of a series | Number-led count | 5,543 | Carousel |
| A study tip from a 4.0 GPA student, ending in a colon | Colon set-up | 4,078 | Carousel |
| Tool plus tool equals an outcome | Mechanism or comparison | 3,191 | Video |
| A command to save 5 prompts for a named tool | Imperative command | 3,026 | Carousel |
| An "unpopular opinion" about gear and settings | Contrarian opener | 2,799 | Text |
| A command to steal a prompt before it goes viral | Imperative command | 2,685 | Carousel |
Seven of these ten carry media. The three text posts are all strong opinions. I treat that as a pattern to try, not as proof, and so should you.
My own verdict on the hook list: it is a good set of patterns to try, and it is not evidence that any of them work.
Media Is the Tactic That Held Up
Here is the good news. One writing decision held up better than any other I tested, and it is still observational.
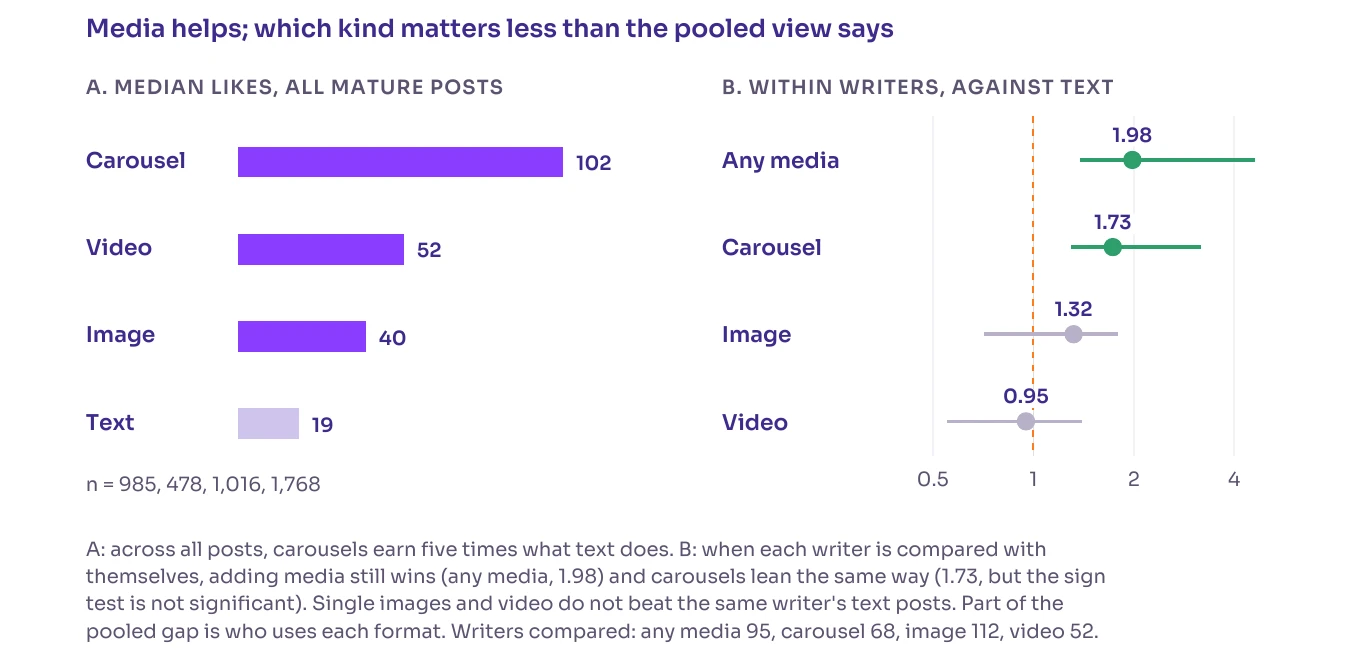
Panel A is the pooled ranking: carousels earn a median of 102 likes, video 52, images 40 and text 19. Carousels earn five times what text does. That ranking reproduced exactly from my August numbers.
Panel B is the fair test. For writers who post both ways, I compared their media posts with their own text posts. Green means the interval sits above 1.
| Format | Posts | Median likes | Pooled lift | Share reaching 1,000 likes | Within writers vs text (95% CI) |
|---|---|---|---|---|---|
| Carousel | 985 | 102 | 2.68 | 14.1% | 1.73 (1.3 to 3.18) |
| Video | 478 | 52 | 1.37 | 10.3% | 0.95 (0.55 to 1.4) |
| Image | 1,016 | 40 | 1.05 | 5.7% | 1.32 (0.71 to 1.79) |
| Text | 1,768 | 19 | 0.50 | 7.1% | reference |
| Any media against text | 1.98 (1.38 to 4.61), 95 writers |
Attaching any media earns about twice what the same writer's text posts earn. This is one of only two tactics in my 23-tactic battery that survive correction.
Carousels lean the same way at 1.73, but their sign test misses significance (p = 0.068), so I call that suggestive. Single images and video did not beat text within writers.
Video is the odd one out. It looks fine pooled and flat within writers, so part of the pooled video lead is who makes video.
Meta's guidance rhymes with this. Its October 2024 creator guidance says video, photo and carousel posts that include text average more views than those without text. That compares media posts with and without text, while my 1.98 compares media with text-only posts, so the two do not test the same thing. Buffer's 2026 engagement report also ranks formats by median engagement rate, with video at 5.55%, images at 4.55%, text at 2.79% and link posts last at 2.34%. Buffer measures a rate on its own customers and I measured likes on surfaced posts, so treat the two as a rhyme and not as confirmation.
Length and Line Count: Short Is Not a Rule
My teardown said to keep captions under about 80 characters. Pooled, the shortest posts do earn the most.
| Characters | Posts | Median likes | 95% CI |
|---|---|---|---|
| Under 80 | 827 | 60 | 48 to 78 |
| 80 to 159 | 993 | 40 | 32 to 48 |
| 160 to 299 | 1,105 | 42 | 33 to 49 |
| 300 to 499 | 1,283 | 26 | 22 to 30 |
| 500 or more | 39 | 18 | 10 to 66 |
Within writers, short posts earn 0.85 times the same writer's longer posts (interval 0.52 to 2.06) and posts of 300 or more earn 0.90 (0.5 to 1.3). Both intervals include 1. Short posts come from writers whose posts do well anyway.
Line count shows no pattern even pooled: a one-line post has a median of 37 likes, 2 to 3 lines 45, 4 to 6 lines 39, 7 to 10 lines 32 and 11 or more lines 40.
What Each Format Earns Besides Likes
Likes are not the only currency. Among mature posts with at least 200 likes, reposts and replies follow format closely.
| Format | Posts | Reposts per 100 likes | Replies per 100 likes |
|---|---|---|---|
| Carousel | 377 | 10.3 | 1.8 |
| Video | 153 | 6.0 | 3.5 |
| Image | 238 | 6.2 | 4.9 |
| Text | 357 | 5.7 | 6.6 |
| All formats | 1,125 | 7.1 | 3.88 |
Carousels get saved and shared. Text posts get answered. My August claim that "reposts, not replies, are the amplifier" holds on average, but it is mostly a statement about carousels.
The reply side matters because Meta says replies account for almost half of the views on Threads. If you want replies, text posts earn the most of them relative to their likes.
The Writer Matters More Than the Post
My teardown claimed that "a post's ceiling is set by the post, not the account". It based that on accounts under 1,000 followers having the highest best posts. Go back to panel B of Figure 9.1 above.
The under-1K group shows a median best post of 4,872. The 1K to 10K group shows 2,513. It looks like small accounts win.
| Follower band | Writers | Median best post | Median average | Best post per follower |
|---|---|---|---|---|
| Under 1K | 12 | 4,872 | 1,048 | 13.14 |
| 1K to 10K | 16 | 2,513 | 293 | 0.46 |
| 10K to 50K | 19 | 1,208 | 196 | 0.06 |
| 50K to 250K | 9 | 1,869 | 297 | 0.03 |
| 250K and over | 3 | 3,032 | 477 | 0.01 |
Here is the trap. Those small accounts entered my sample because one of their posts went viral. Search found them through their hits, so their best posts are high by construction. The bar measures how I found them. It says nothing about what a small account can expect.
A 20-follower account did reach 18,617 likes with a carousel. That is true, it is worth knowing as a possibility, and it is one account among 59 I profiled.
Who You Are Carries 40% of the Spread
The cleanest measure comes from the 383 writers who have two or more mature posts, with 1,233 posts between them. Among them, 40% of the spread in likes (on a log scale) lies between writers, not within them.
Two posts from the same writer are far more alike than two posts from different writers. That is the reason the pooled and within-writer readings disagree so often. Any feature that good writers favor looks like a tactic.
Posting More Often: The Average Lies
My road plan said to raise your cadence, because accounts with 7 to 12 posts in the sample had a much higher average than those with 4 to 6.
| Posts in the corpus | Writers | Median of averages | Median of medians (typical post) |
|---|---|---|---|
| 4 to 6 | 147 | 58 | 12 |
| 7 to 12 | 55 | 170 | 16 |
| 13 or more | 6 | 146 | 38 |
The average jumped from 58 to 170. The typical post went from 12 to 16. A few huge posts drove the average.
My data also does not record how often anyone posts. It records how often search surfaced them, which is itself a sign of success. A separate case study of one account that posts about seventy times a day found that extra posts on a day split a fixed pool of likes instead of adding to it.
For reference, Meta recommends at least two to five posts a week for building an audience, and a BlackTwist analysis of 21,864 posts from 283 creators called 5 to 6 posts a week the sweet spot for median follower growth. That sample only includes creators with 100 or more followers and 1,000 or more views, so it leans toward people who already do well. None of these sources assigned posting rates at random.
The Verified Badge
Verified writers' mature posts earn a median of 72.5 likes against 30 for everyone else, and the gap holds inside the AI pass (2.13 times). Verified writers wrote 23.4% of the mature posts in my set.
I cannot say whether the badge causes any of that, because no writer gains or loses the badge inside my data. Here is what I can say. Meta said at launch that Instagram verification carries over to Threads, and on Instagram and Facebook Meta Verified is a paid monthly subscription with an ID check. That second page predates Threads and does not mention it, so I read the badge as something that can reflect a purchase.
So the badge may reflect a choice to pay as much as it reflects standing, though I cannot separate the two. In an early draft of my report I called it a mark of account size, and my own build checks caught that error before I published.
Languages: Why I Stopped Calling Non-English an Open Lane
My teardown said Japanese, Korean, Chinese and Portuguese AI posts earn about 3.5 times the median, and called non-English posting an open lane. That claim was wrong, and this chart shows why.
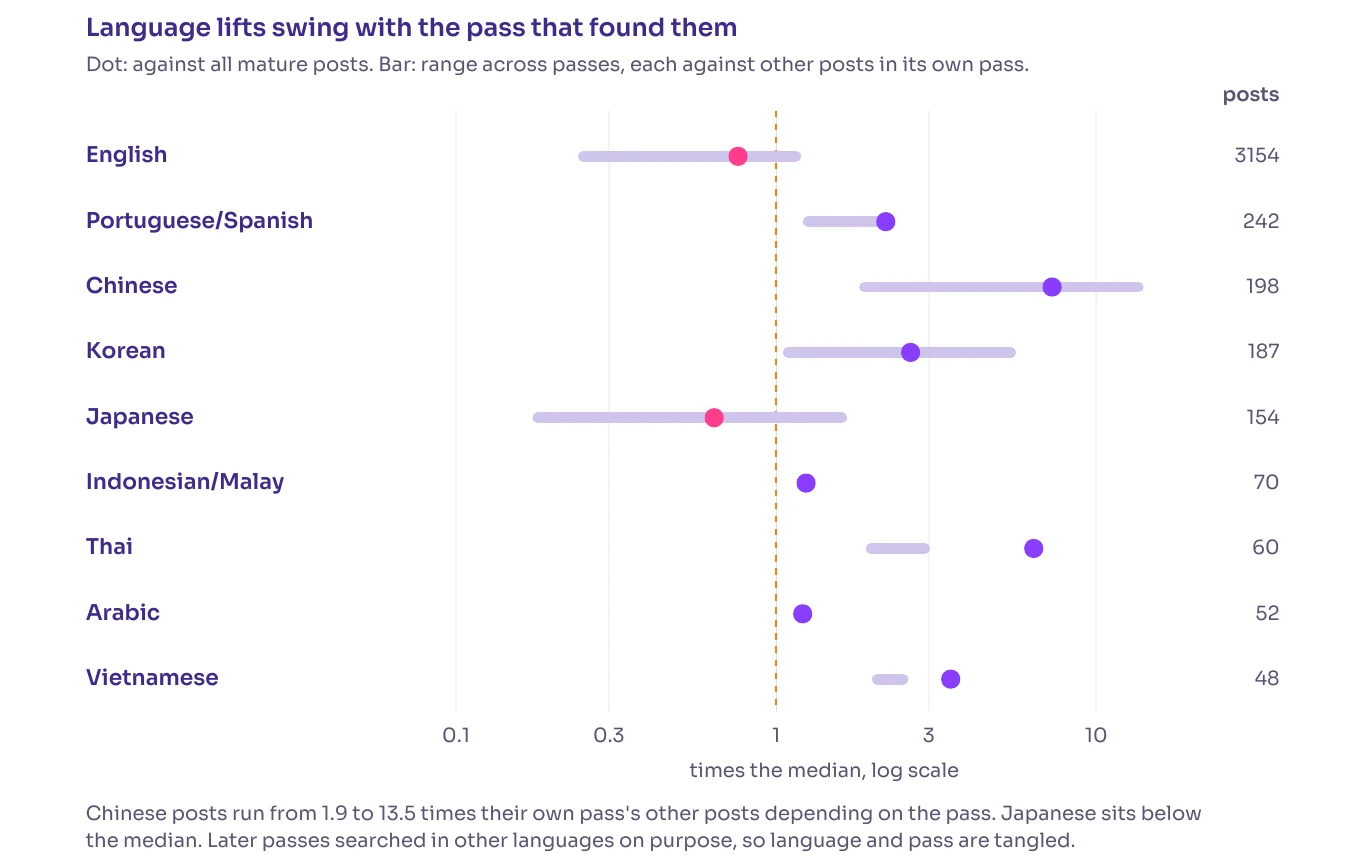
Each dot is a language measured against all mature posts. Each pale bar is the range of that language's lift inside each collection pass, compared with the other posts in the same pass. Pink dots sit below the median.
| Language | Posts | Median likes | Pooled lift | Range across passes |
|---|---|---|---|---|
| English | 3,154 | 29 | 0.76 | 0.25 to 1.15 |
| Portuguese or Spanish | 242 | 83.5 | 2.20 | 1.26 to 2.2 |
| Chinese | 198 | 276.5 | 7.28 | 1.89 to 13.53 |
| Korean | 187 | 100 | 2.63 | 1.09 to 5.4 |
| Japanese | 154 | 24.5 | 0.64 | 0.18 to 1.6 |
| Thai | 60 | 242.5 | 6.38 | 1.98 to 2.91 |
| Vietnamese | 48 | 133.5 | 3.51 | 2.07 to 2.49 |
The table lists seven of the nine languages in the figure.
Pooled, non-English posts as a group earn 2.26 times the median. Chinese posts beat the other posts in their own pass in every pass, by anywhere from 1.89 to 13.53 times. The direction is real. The size is not knowable from my corpus.
Japanese posts sit below the median at 0.64. Non-English posts make up 15.4% of the AI pass and 45.8% of the other passes, because I searched in other languages on purpose, so language and pass are tangled together. No writer switches language often enough to test within writers.
My conclusion: do not choose a language because of a headline multiplier. Write in the language your real audience reads.
Links, Timing and Other Algorithm Signals
Threads does not publish how it ranks posts, and a sample of posts seen from the outside cannot reveal the rules. What I can do is test the patterns I inferred in August. Of the nine algorithm claims in my teardown, two hold, two hold in part, two are not shown within writers, one is wrong and two rest on too few posts.
The Outbound Link Is the Clearest Cost
This claim held up in every reading.
| Reading | Posts with an outbound link vs without |
|---|---|
| Pooled median likes | 7 against 40 |
| Inside the AI pass | 0.27 times the pass median |
| Within writers | 0.30 (95% CI 0.13 to 0.73), 30 of 41 writers did worse with a link |
| Text posts only (link preview is the only visual) | 0.32 (112 posts) |
Only 3.6% of mature posts carried an outbound link. The within-writer cost is smaller than the raw gap, and it is still about 70% of a post's likes. It survives my multiple-test correction, with an adjusted p of 0.050, right at the line. Because the interval runs from 0.13 to 0.73, the true cost could sit anywhere from about 27% to 87%.
An outbound link in the post body cost about 70% of a post's likes, even when I held the writer fixed. It is the clearest cost in my corpus.
Is this a penalty from Threads, or do people just not like links? My data cannot tell you. I measured likes, not reach.
Meta's own story has shifted over time. As Social Media Today reported, Adam Mosseri said in November 2024 that Threads does not downrank links but that people rarely like or comment on them, and in June 2025 he said links had been working much better for more than a month. The same article warns that "ranked properly" does not guarantee more visibility. Buffer's 2026 data also puts link posts last on median engagement rate, at 2.34%.
What I would do with that: keep links out of the post body. Meta lets you add up to five links to your bio and shows how many people visited the links you shared. Whether a link in the first reply avoids the cost is untested in my data, because I did not collect replies.
Timing Is a Small Lever
My teardown said Saturday is the strongest day. The data gives Saturday the best support of any timing claim, and it is still not enough to rule out no effect.
| Day (UTC) | Posts | Median likes | 95% CI | AI-pass median |
|---|---|---|---|---|
| Mon | 594 | 36 | 25 to 46.5 | 27.5 |
| Tue | 664 | 36 | 29 to 44 | 32 |
| Wed | 735 | 29 | 24 to 37 | 23 |
| Thu | 772 | 31.5 | 25.5 to 38 | 28 |
| Fri | 506 | 49.5 | 40 to 61 | 31 |
| Sat | 470 | 54 | 40 to 84.5 | 45.5 |
| Sun | 506 | 48 | 37 to 64 | 33.5 |
Saturday leads the pooled reading at 54 likes (1.42 times the median) and the AI pass (1.52). Within writers it is 1.54, with an interval from 0.98 to 2.5. Weekend posting as a whole is flat within writers at 1.18 (0.88 to 1.96).
The outside sources disagree with each other, which is a useful warning:
Different metrics, different time zones and different samples explain part of it. My takeaway: timing is a small lever next to topic and media. Use your own Insights (I show mine below) instead of a universal "best time".
Threads-Specific Tactics Did Not Pass
I also tested the tactics that are specific to Threads culture.
| Pattern | Posts | Median | Pooled lift | Within writers (95% CI) |
|---|---|---|---|---|
| Algorithm seeding ("connect me with people who like...") | 34 | 67 | 1.76 | 7 writers, too few to test |
| BREAKING framing | 82 | 49 | 1.29 | 1.92 (0.52 to 5.88) |
| Year stamp such as "2026" | 185 | 48 | 1.26 | 1.00 (0.55 to 2.97) |
| Reply bait | 39 | 40 | 1.05 | 9 writers, too few to test |
| "Free" framing | 216 | 30 | 0.79 | 1.03 (0.48 to 1.88) |
| "Secret" or "hidden" framing | 57 | 20 | 0.53 | 1.29 (0.39 to 2.92) |
My teardown called algorithm seeding "the highest-lift tactic measured". It rests on 34 posts with an interval from 35 to 214 likes, and it does not pass correction. Meta announced an official control called Your Algo in June 2026. It lets you tell Threads to show more or less of certain topics for one, three or seven days, and it was rolling out in the US, Canada, UK, Australia and New Zealand. A post asking to be connected with the right people is no longer the only way to steer your own feed.
What Meta Says Against What I Measured
Meta's public guidance is the closest thing to a rulebook. Most of its numbers come from internal analysis, and the creators page footnotes some of its statistics as internal analysis over a 30-day period in the first half of 2024. I list them next to my results, side by side.
| Topic | What Meta says | What my data shows |
|---|---|---|
| Replies | Replies account for almost half of the views on Threads | Text posts earn the most replies per like (6.6 replies per 100 likes, among mature posts with at least 200 likes). I could not test the effect of replying |
| Conversation | Posts that drive conversations are more likely to be recommended | Question openers (0.95) and question posts (0.78) did not beat the same writer's other posts |
| Media | Video, photo and carousel posts that include text average more views than those without text | Any media 1.98 times the same writer's text-only posts. Meta compares media with and without text, so this is a rhyme and not a match |
| Topic tags | Meta's internal data says posts with tagged topics generally get more views | Hashtag-style captions flat within writers (1.06 to 1.12, depending on the definition). Different thing, not a contradiction |
| Bait and giveaways | The creators page says clickbait, engagement bait and contest or giveaway promotions face distribution limits | Prompt and template giveaways broke out less often (4.4%). My category is a prompt giveaway, which is not the same as a contest |
| Weekends | Posting more often on weekends can drive engagement | Saturday leans up (1.54), not conclusive |
| Frequency | At least 2 to 5 posts a week | My sample does not record how often anyone posts, so I cannot test this. Extra posts on one day split a fixed pool in my seventy-posts-a-day case study |
| Links | Mosseri says link ranking improved. People rarely like links | 0.30 within writers |
Meta's advice and my data point the same way on media, although the two compare different things. On questions, my data shows no lift. It cannot test conversation bait or replying at all, because reply bait had only 9 writers and I did not collect replies.
My Own Threads Insights: What 249,062 Views Looks Like
Everything above uses likes, because Threads showed no view count on other people's posts when I collected the data. On your own account you get more. Meta's Insights tab shows views, interactions, follower growth and audience demographics over 7 to 90 days. On the web, you open threads.com/insights.
I opened mine on 6 October 2026 with the range set to "Last 30 days". These are real screenshots, in four panels.
Panel 1: The Overview
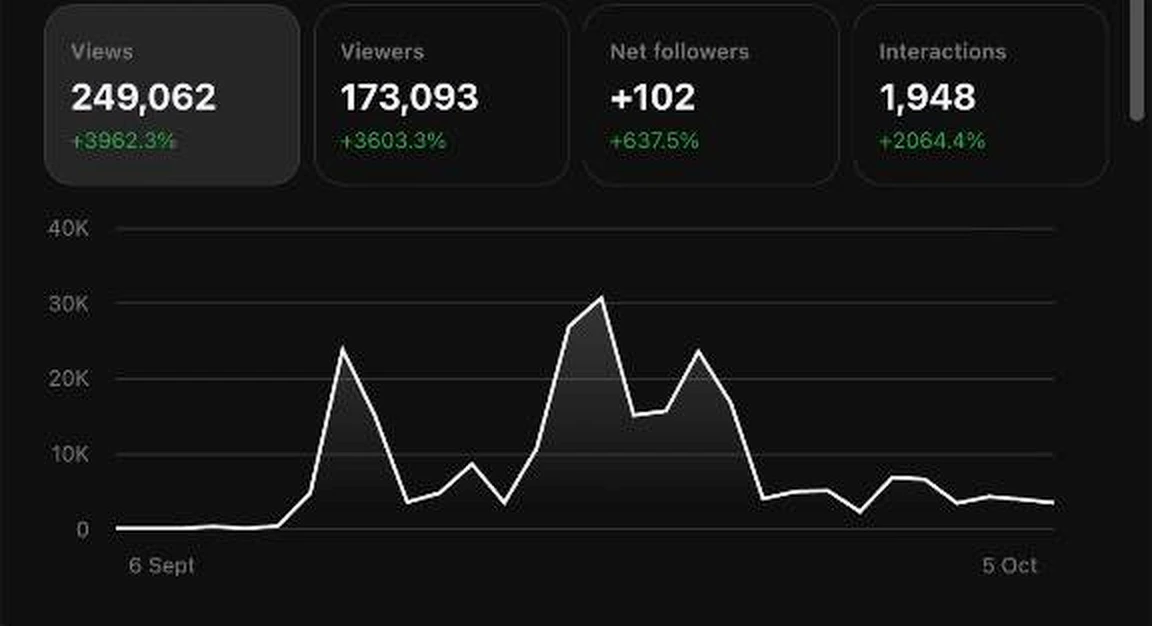
My Threads Insights overview, 6 Sept to 5 Oct 2026.
| Metric (last 30 days) | Value | Change shown by Meta |
|---|---|---|
| Views | 249,062 | +3,962.3% |
| Viewers | 173,093 | +3,603.3% |
| Net followers | +102 | +637.5% |
| Interactions | 1,948 | +2,064.4% |
Meta's AI summary on the same page called it a breakout month, with views up roughly 40x, which matches +3,962.3% (a 40.6 times multiple). The page labels the viewer and follower percentages "since 6 Sept" and does not say what the views percentage compares against. If it compares with the 30 days before, those 30 days had about 6,100 views.
Now read the chart. It is not a smooth climb. It has three spikes, the tallest just above 30,000 views in a single day, and a long tail of roughly 2,500 to 7,000 views a day afterwards.
That is Figure 4.1 again, on one account. A handful of days carried a large share of the views.
The tail also tells me something. The ten most recent posts in my Insights list (53, 97, 25, 287, 15, 22, 128, 90, 13 and 63 views) add up to 793 views in total. The right edge of the chart still shows about 3,500 views a day, so most of those views probably come from older posts that Threads keeps serving.
One rate to keep: interactions divided by views is 1,948 / 249,062, or 0.78%.
Panel 2: Who Viewed
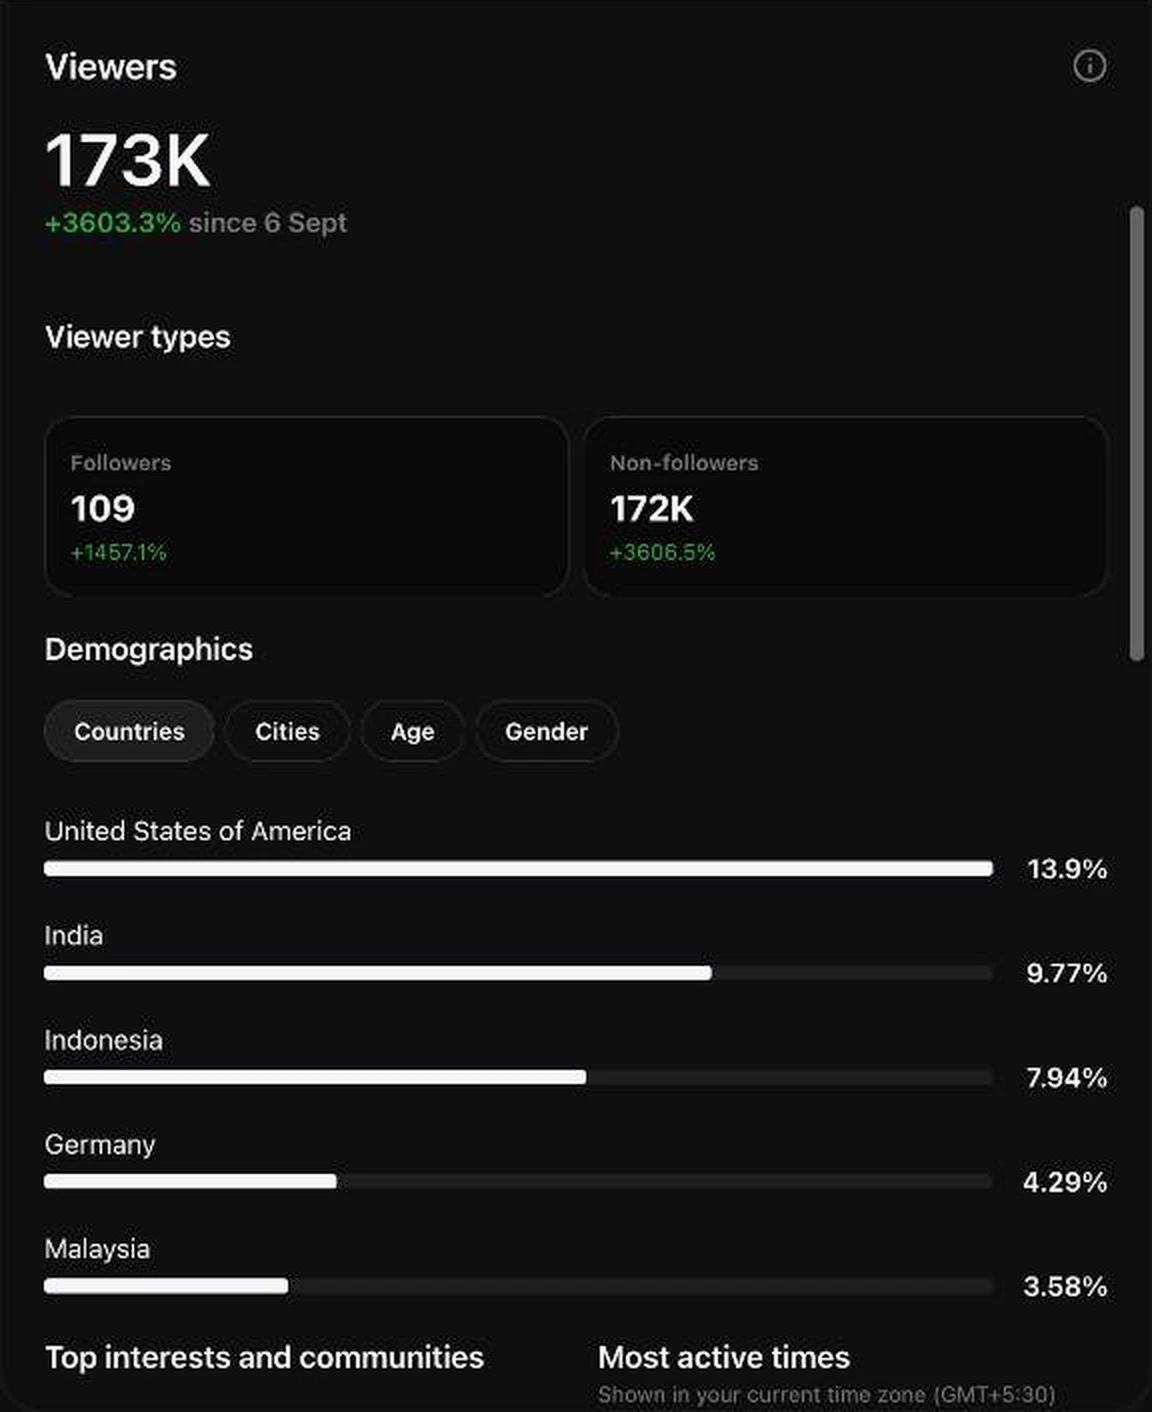
Viewer types and top countries in my Insights.
Of 173,093 viewers, 109 were followers and about 172,000 were not. That is more than 99.9% non-followers.
Almost nobody who saw my posts followed me already. Threads showed my posts to people who did not follow me. Viewer countries lead with the United States (13.9%), India (9.77%), Indonesia (7.94%), Germany (4.29%) and Malaysia (3.58%). Those five add up to about 39.5%, so roughly 60% of viewers come from other countries.
Panel 3: Communities and Active Times
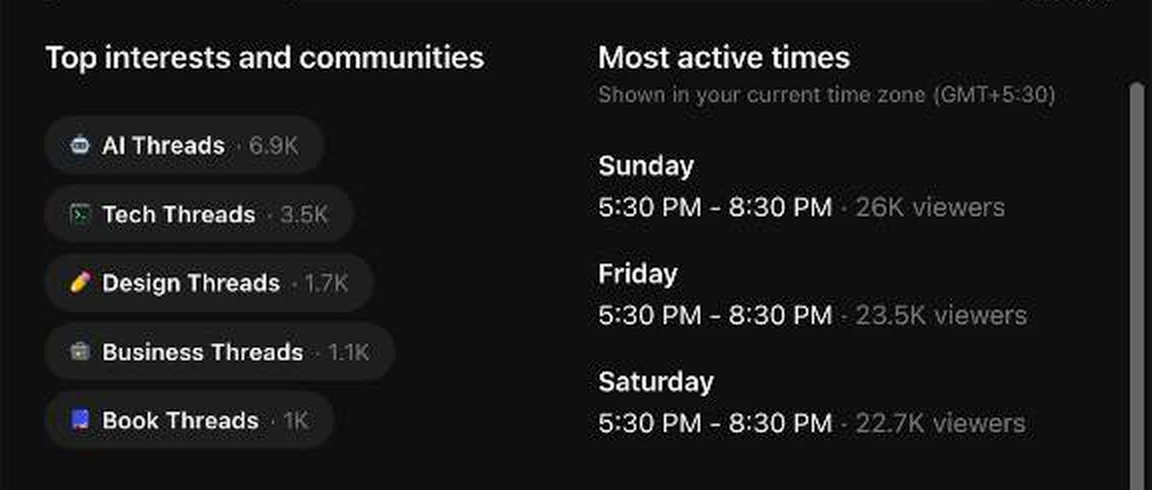
Top communities and most active times in my Insights (GMT+5:30).
AI Threads leads my viewers' communities at 6.9K, followed by Tech Threads (3.5K), Design Threads (1.7K), Business Threads (1.1K) and Book Threads (1K). I did not open the age and gender tabs, and the AI summary line was cut off in my screenshots, so I have no audience age or gender numbers to report.
The "Most active times" box shows when my viewers are on Threads, in my own time zone: Sunday, Friday and Saturday, each from 5:30 PM to 8:30 PM, with 26K, 23.5K and 22.7K viewers. That tells you when people are around. It does not prove that posting then wins. My report found a lean toward Saturday and no proof.
Panel 4: Followers
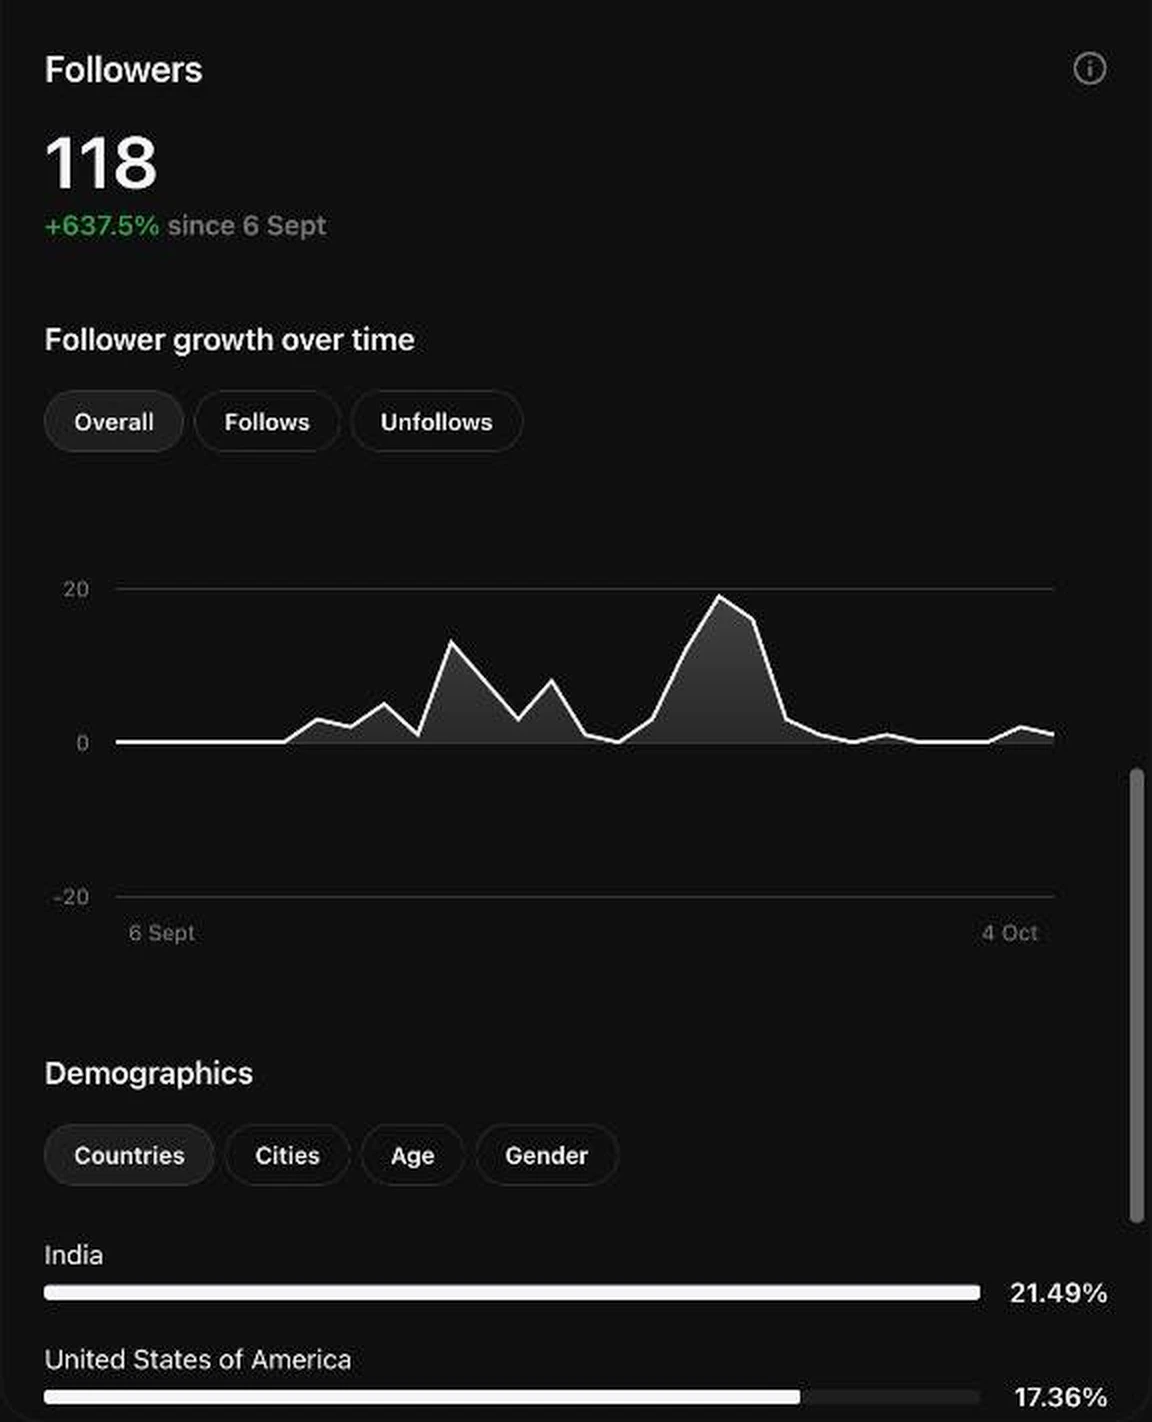
Follower growth and follower countries in my Insights.
I ended the window with 118 followers, up from about 16 on 6 September. The follower chart shows bumps that echo the view spikes, with a peak near 19 net new followers in a day. My followers lean more toward India (21.49%) than my viewers do (9.77%), then the United States (17.36%), Indonesia (5.79%), Nigeria (4.96%) and Malaysia (3.31%).
Now the number that matters most for growth: 102 net new followers from 173,093 viewers is 0.059%. That is about 0.6 new followers for every 1,000 people who saw me.
Reach is not the same as an audience. My last 30 days put my posts in front of about 172,000 non-followers, and roughly six of every 10,000 viewers followed me.
What I Would Not Conclude From My Own Screenshots
If you want to test your own account the way I tested the corpus, you need your own post-level data. The audit cheatsheet below shows you how.
The 23-Tactic Battery: Each Writer Against Themselves
Many individual tests can fool you. Run 23 of them and a few will look significant by luck. So I built one master test, a battery of 23 common writing tactics, each measured the same way: each writer against their own other posts.
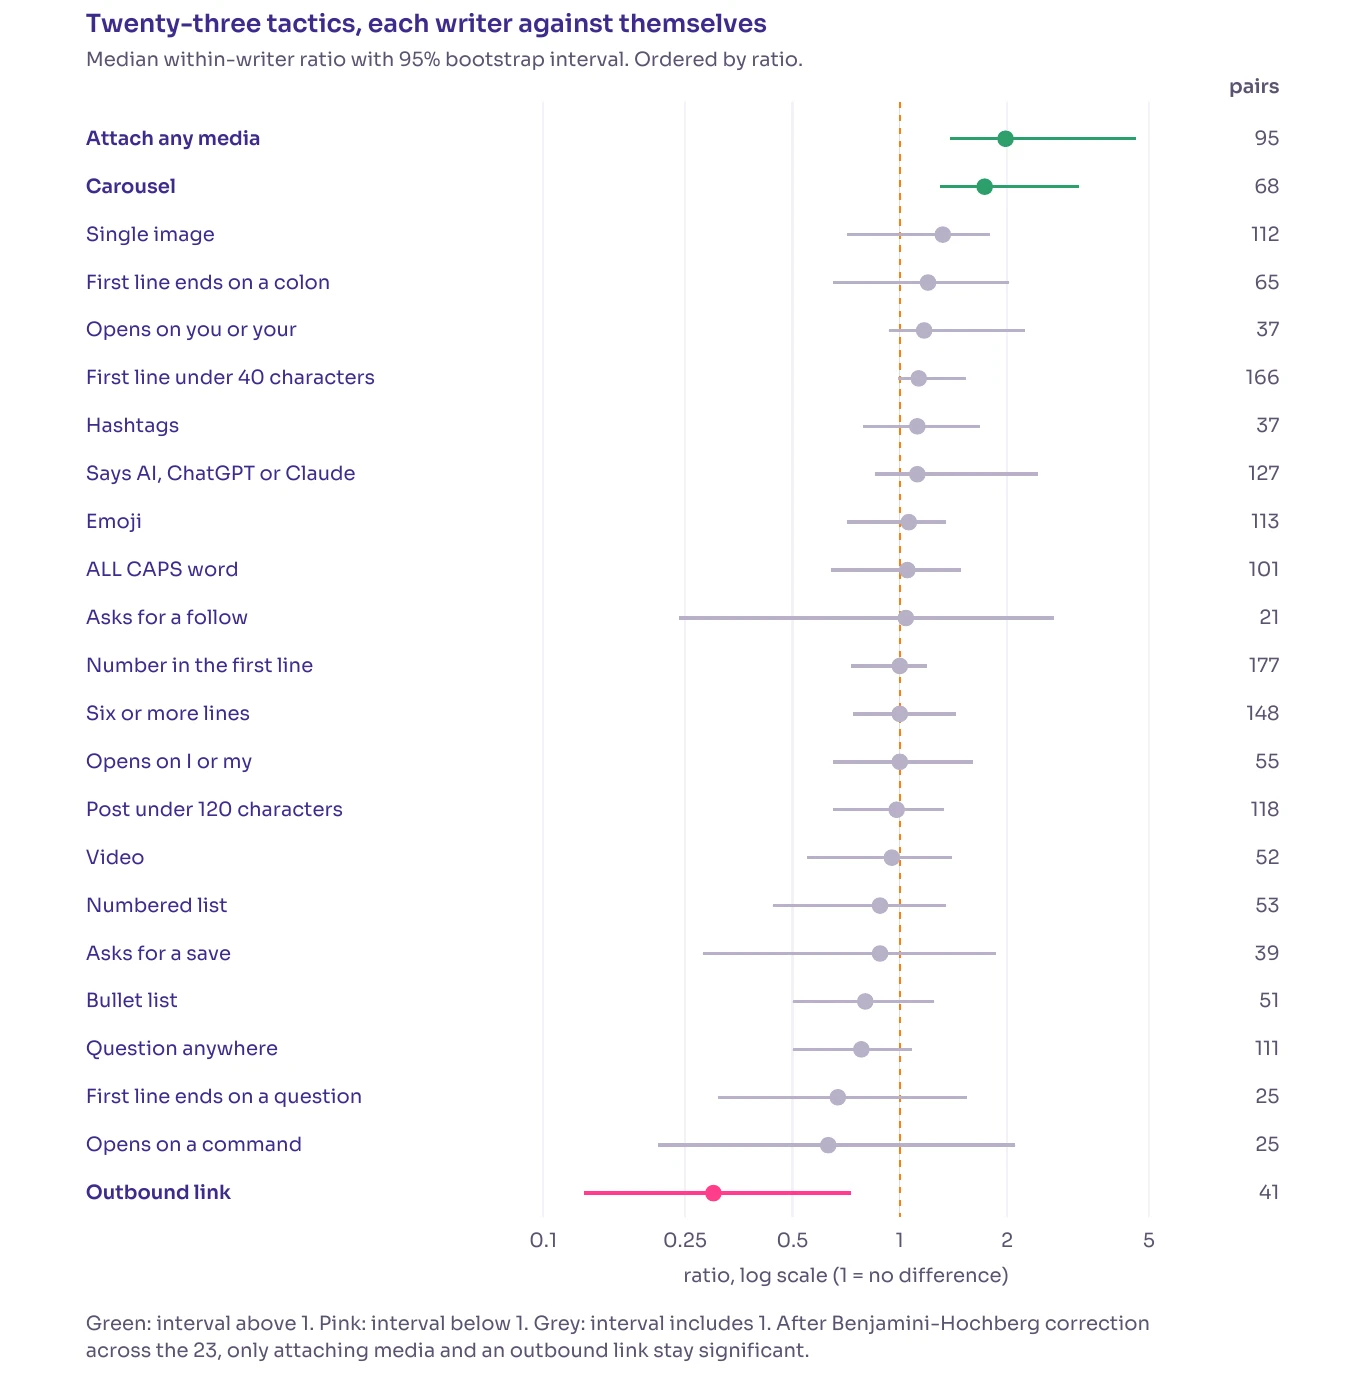
How to read it: each row is a tactic. The dot is the median within-writer ratio, and the line is the 95% bootstrap interval. The right-hand column counts how many writers could be compared. The axis is a log scale, and 1 means no difference.
Green rows have an interval above 1. The pink row has an interval below 1. Grey rows include 1, which means the data cannot tell them apart from "no effect".
Three tactics have intervals that exclude 1: attaching any media (1.98), carousels (1.73) and an outbound link (0.3). After the Benjamini-Hochberg correction across all 23, two survive: media (adjusted p = 0.006) and the link (0.050). The carousel's interval clears 1 but its sign test does not, so I report it as suggestive.
| Tactic | Writers | Ratio | 95% CI | Adjusted p |
|---|---|---|---|---|
| Attach any media | 95 | 1.98 | 1.38 to 4.61 | 0.006 |
| Carousel | 68 | 1.73 | 1.30 to 3.18 | 0.522 |
| Single image | 112 | 1.32 | 0.71 to 1.79 | 0.967 |
| First line ends on a colon | 65 | 1.20 | 0.65 to 2.03 | 0.967 |
| Opens on "you" or "your" | 37 | 1.17 | 0.93 to 2.24 | 0.996 |
| First line under 40 characters | 166 | 1.13 | 0.99 to 1.53 | 0.717 |
| Hashtags | 37 | 1.12 | 0.79 to 1.68 | 0.992 |
| Says AI, ChatGPT or Claude | 127 | 1.12 | 0.85 to 2.44 | 0.992 |
| Emoji | 113 | 1.06 | 0.71 to 1.35 | 0.992 |
| ALL CAPS word | 101 | 1.05 | 0.64 to 1.48 | 0.992 |
| Asks for a follow | 21 | 1.04 | 0.24 to 2.71 | 1.000 |
| Number in the first line | 177 | 1.00 | 0.73 to 1.19 | 1.000 |
| Six or more lines | 148 | 1.00 | 0.74 to 1.44 | 1.000 |
| Opens on "I" or "my" | 55 | 1.00 | 0.65 to 1.60 | 1.000 |
| Post under 120 characters | 118 | 0.98 | 0.65 to 1.33 | 1.000 |
| Video | 52 | 0.95 | 0.55 to 1.40 | 1.000 |
| Numbered list | 53 | 0.88 | 0.44 to 1.35 | 0.992 |
| Asks for a save | 39 | 0.88 | 0.28 to 1.86 | 0.992 |
| Bullet list | 51 | 0.80 | 0.50 to 1.25 | 0.992 |
| Question anywhere | 111 | 0.78 | 0.50 to 1.08 | 0.717 |
| First line ends on a question | 25 | 0.67 | 0.31 to 1.54 | 0.992 |
| Opens on a command | 25 | 0.63 | 0.21 to 2.11 | 0.992 |
| Outbound link | 41 | 0.30 | 0.13 to 0.73 | 0.050 |
A grey interval does not prove a tactic is useless. A null result at this sample size is an absence of evidence, not proof of no effect. Short first lines and Saturday both sit close to the line.
I also reran the battery after changing the method: 2,000 resamples instead of 800, ties set aside in the sign test and correction across all 23. No verdict changed.
How I Attacked My Own Findings
An analysis built with language-model agents can be fluent and wrong at the same time. So I attacked this one twice.
Round 1: Nine Analysts, Nine Refuters
Nine analyst agents each mined one dimension of the corpus: white space, brands, creators, the engagement funnel, opening-line phrases, the anatomy of top posts, language, timing and harmful patterns. Then nine refuter agents each got one analyst's headline claim and a simple order: recompute the numbers from the raw data, hunt for a confound, and default to "refuted" where the evidence is thin.
I used separate agents because a model checking its own work tends to confirm it. Debate between several model instances improves factual accuracy, and models struggle to correct their own reasoning without outside feedback.
| Dimension | Analyst's headline claim (shortened) | Verdict |
|---|---|---|
| White space | Consumer-device how-to is the biggest white space | Refuted |
| Brands | Naming an AI tool is a net negative | Refuted |
| Creators | Consistent "metronome" creators earn 8.1 times the baseline | Refuted |
| Funnel | Format, not topic, decides the funnel stage | Refuted |
| Phrases | Naming AI in your hook is the surest way to lose reach | Refuted |
| Anatomy | Format beats status in the top decile | Refuted |
| Language | English posts run below baseline while non-English run well above | Refuted |
| Timing | Timing is close to a non-lever | Survived |
| Anti-patterns | An outbound link is the costliest thing in a post | Survived |
Seven of nine headline claims were refuted. The two that survived were the weakest sounding: timing is close to a non-lever, and an outbound link is the costliest thing a post can carry.
Round 2: The Battery as the Arbiter
The refuters were not always right, so I used a test that does not argue. In two cases the battery overruled them:
Adversarial review is a filter, not an oracle. It catches claims that rest on a confound, and it can also raise objections that sound plausible and are false. In both cases the arbiter was a stricter estimator, not a more forceful argument.
What the Checks Caught in My Own Report
The build found five errors in my own report before I published it:
I fixed each one before I froze the numbers.
All 35 Claims From My August Teardown, Graded
Here is the scoreboard.
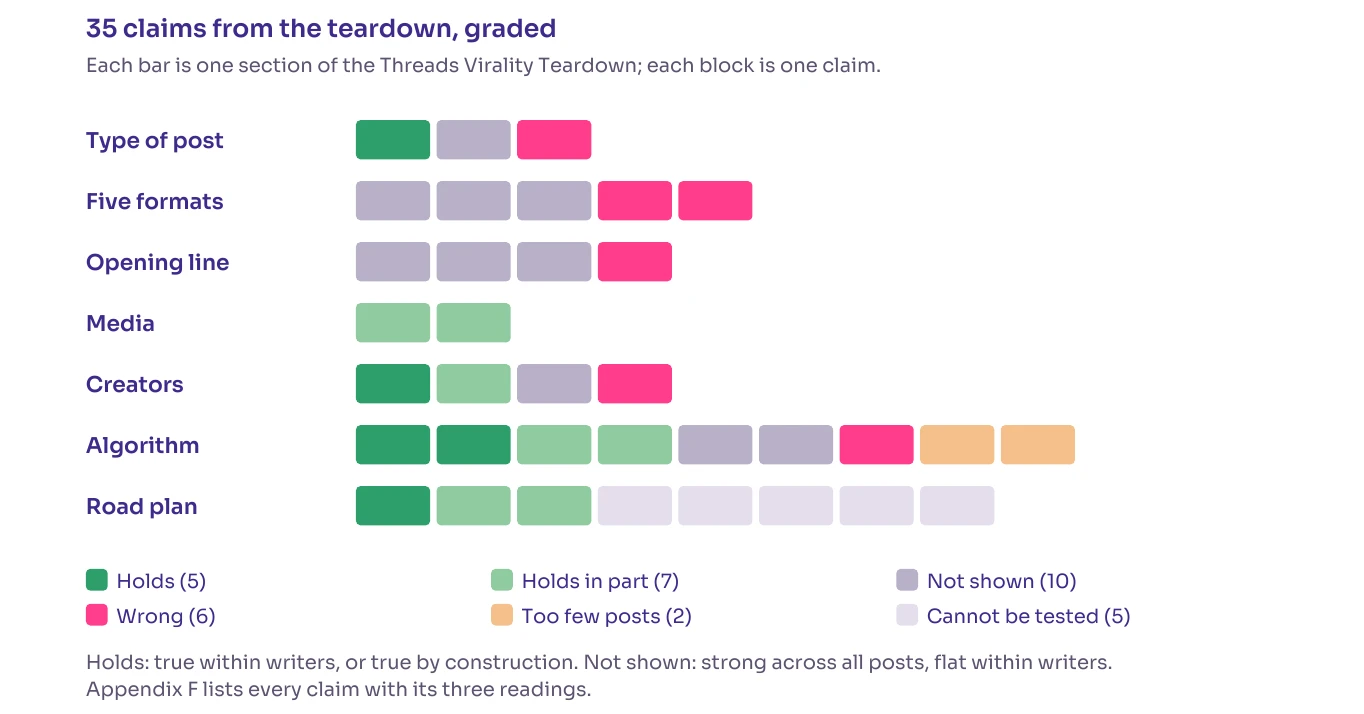
Each row is a section of my teardown and each block is one claim. Dark green means the claim holds. Light green means it holds in part. Grey-purple means "not shown", pink means wrong, orange means too few posts and pale grey means it cannot be tested with a sample of posts.
| Verdict | Claims | What it means |
|---|---|---|
| Holds | 5 | True when each writer is compared with themselves, or true by construction |
| Holds in part | 7 | True in one reading or in part of the claim |
| Not shown | 10 | Strong across all posts, flat when each writer is compared with themselves |
| Wrong | 6 | The data says otherwise |
| Too few posts | 2 | Too rare to test reliably |
| Cannot be tested | 5 | Advice about behavior a sample of posts cannot observe |
The ten "not shown" claims are the ones most worth knowing about, because they look strong in exactly the kind of data most Threads advice is built from.
The Full Register
| # | My August claim (shortened) | Verdict | Key number |
|---|---|---|---|
| 1 | Top 1% of posts take about a third of likes, top 10% nearly four fifths | Holds | 34.3% and 79.0% |
| 2 | Contrarian and personal proof posts have the highest share over 1,000 likes | Wrong | 8.2% and 7.1% against 8.8% |
| 3 | News, listicles and tutorials are the reliable formats | Not shown | Within writers 1.46, 0.88, 1.34 |
| 4 | The 24-hour news drop is the strongest reliable format | Not shown | 1.68 pooled, 1.46 within |
| 5 | The organized stack earns about 1.8 times the median | Not shown | 0.88 within writers |
| 6 | The one-screen tutorial is a winning format | Not shown | 0.95 pooled, 1.34 within |
| 7 | The credible contrarian has a top-tier breakout rate | Wrong | 1.01 within writers |
| 8 | The receipt has the highest breakout rate of any family | Wrong | 7.1%, below news |
| 9 | Commands are the best opening and questions the worst | Wrong | 0.60 and 0.95 within writers |
| 10 | Never open on a question | Not shown | 0.67 (0.31 to 1.54) |
| 11 | Name the tool, number or outcome in the first six words | Not shown | 1.00 within writers |
| 12 | Keep it under about 80 characters | Not shown | 0.85 (0.52 to 2.06) |
| 13 | Carousels beat video, video beats images, images beat text | Holds in part | Any media 1.98 |
| 14 | One carousel or short video a day beats three text posts | Holds in part | Carousel 1.73, video 0.95 |
| 15 | A post's ceiling is set by the post, not the account | Wrong | Writers hold 40% of the spread |
| 16 | A 20-follower account can reach 18,000 likes | Holds | 18,617 likes, one of 59 profiled |
| 17 | Verified accounts do better | Holds in part | 72.5 against 30 likes |
| 18 | Accounts with 7 to 12 posts have a much higher average | Not shown | Typical post 16 against 12 |
| 19 | An outbound link costs a post most of its likes | Holds | 0.30 (0.13 to 0.73) |
| 20 | Reposts, not replies, are the amplifier | Holds in part | 7.1 and 3.88 per 100 likes, mostly carousels |
| 21 | Bullet lists double the median | Not shown | 1.53 pooled, 0.80 within |
| 22 | Hashtags do nothing | Holds | 1.12 (0.79 to 1.68) |
| 23 | A year stamp such as 2026 adds a measurable lift | Not shown | 1.26 pooled, 1.00 within |
| 24 | Japanese, Korean, Chinese and Portuguese AI posts earn about 3.5 times the median | Wrong | Japanese 0.64 |
| 25 | Saturday is the best day to post | Holds in part | 1.54 (0.98 to 2.5) |
| 26 | Algorithm seeding is the highest-lift tactic | Too few posts | 34 posts, 7 writers |
| 27 | Asking for a repost performs at a fifth of the median | Too few posts | 26 posts, 6 writers |
| 28 | Gemini and NotebookLM, AI image and video, and Claude are the hottest lanes | Holds in part | All lead in one pass, Claude flat within |
| 29 | ChatGPT is the most crowded lane | Cannot be tested | Reflects my search list |
| 30 | Make money with AI is the worst topic | Holds in part | Flat within writers (1.0) |
| 31 | Free framing is neutral for likes | Holds | 1.03 (0.48 to 1.88) |
| 32 | Reply to 10 bigger accounts in your lane every day | Cannot be tested | Behavior off the page |
| 33 | Re-cut a winner into a different media type | Cannot be tested | Behavior off the page |
| 34 | Answer every comment in the first hour | Cannot be tested | Behavior off the page |
| 35 | Give away one useful asset in the replies | Cannot be tested | Behavior off the page |
"Cannot be tested" is not "wrong". Replying to comments may matter a lot. A sample of public posts simply cannot see it. Buffer's study of 128,000 Threads posts links replying to comments with about 42% higher engagement on Threads, and Buffer itself says that is correlation, not guaranteed causation.
What This Study Cannot Tell You
Every result above comes with these limits. I would rather you hear them from me.
Most of what looks like a writing tactic in pooled engagement data is a property of the writers who use it.
My Revised 90-Day Road Plan
My August plan had four phases. I kept its shape and replaced each step with what the evidence supports.
Days 1 to 14: Pick a Subject That Can Show Something
Subject is the largest lever I measured: a 7.9-fold spread between lanes. The lanes at the top can carry visible proof: devices, code, generated images. AI coding is the one topic that beat the same writer's other posts.
Avoid leading with making money from AI. My August advice to never open on a question, keep captions under 80 characters and favor commands is not supported. Write the first line you think is clearest.
Days 15 to 45: Attach Something and Measure Against Yourself
Attach an image, carousel or video to most posts. Within writers this roughly doubles likes against your own text posts, and carousels lean ahead.
Keep links out of the post body. Track every post against your own median, not against large accounts. That is the only comparison in my report that does not mistake a good writer for a good tactic. Drop algorithm seeding as a priority.
Days 46 to 75: Re-Run What Worked and Expect Less
My August plan said to spend two slots a week on contrarian takes and personal stories because of their breakout rates. Those breakout rates are ordinary, so spend the slots on whatever beat your own median.
When a post does well, try it again, and expect the second airing to earn less. In my case study of one high-volume account, re-runs kept about half of what the first airing earned, and they still beat a fresh idea. Post on Saturday if it suits you. The evidence leans that way and is not conclusive.
Days 76 to 90: Compound Without Chasing Volume
More posts per day is not shown to help in my data. Raise volume only if your own numbers say each extra post holds its median.
My August advice to sell in the bio and replies rather than in the hook fits the link result and the money-lane result, so I kept it.
Cheatsheet 1: New Profile Starter Sheet (First 30 Days)
This is the one-page version of my revised plan for an account with no history. Every rule in the first two tables carries a grade from my report, so you know how much weight it deserves. The two-week plan, the tracker and the decision rules are my suggested routine, and my report did not grade them.
How to read the grades:
Day 0: Set Up the Profile
| Step | What to do | Grade |
|---|---|---|
| 1 | Pick one lane a stranger could name after reading three of your posts | Your call |
| 2 | Prefer a lane where a post can show something: a device, a screen of code, a generated image, a result | Holds in part (lane spread is 7.9 times) |
| 3 | If you pick AI coding, you are in the one topic that beat the same writer's other posts | Holds (1.34, adjusted p = 0.012) |
| 4 | Do not lead with "make money with AI" | Holds in part |
| 5 | Write a bio that says what you post and who it helps | Your call |
| 6 | Put your product, newsletter or site in your bio links. Meta allows up to five. This keeps links out of post bodies, where I measured the cost | Your call |
| 7 | Do not count on a badge to fix your reach. It can come from a paid Meta Verified subscription, verification carries over from Instagram, and my data cannot test whether it causes anything | Your call |
| 8 | Open threads.com/insights and screenshot your starting numbers | Sound method |
Anatomy of a Post (Use This for Every Post)
| Part | Rule | Grade |
|---|---|---|
| Media | Attach an image, carousel or video to most posts. Carousels lean best, but test your own mix. Threads allows up to 20 images or videos in one carousel | Holds for any media (1.98 times). Single images (1.32) and video (0.95) were not shown on their own, and carousels leaned (1.73) |
| First line | Write the clearest line you can. Skip formulas | Not shown |
| Body | Short or long, bullets or no bullets. Your call | Not shown |
| Link | None in the post body. Link from your bio or, if you test it, a reply | Holds (about 70% of likes lost) |
| Topic tag | One relevant topic tag at most. Threads treats one tag per post | Your call |
| Ask | At most one ask, never a repost beg | Not shown |
| Hashtag stuffing | Skip it. Hashtags made no difference in any reading, so dropping them costs nothing | Holds |
Your First Two Weeks
| Day | Post idea | Media |
|---|---|---|
| 1 | A result you got this week (proof in the picture) | Image |
| 2 | A short tutorial as a carousel, one step per card | Carousel |
| 3 | News in your lane, with your one-line take | Image or text |
| 4 | A screenshot of your own screen or setup | Image |
| 5 | A comparison of two tools you actually used | Carousel |
| 6 | A text post answering a question someone asked you | Text |
| 7 | Re-cut your best post of the week in a different media type | Different from the original |
| 8 | A before and after | Image or carousel |
| 9 | A short video of the thing working (video was flat within writers at 0.95, so treat it as a test) | Video |
| 10 | A list of 5 resources, no links in the body | Carousel |
| 11 | A mistake you made and what you changed | Text |
| 12 | A checklist as a carousel | Carousel |
| 13 | A Saturday post you prepared in advance (my day counts use UTC, so check your own time zone) | Your best format so far |
| 14 | Review day: compute your median (see tracker) | None |
The day 7 re-cut and the day 13 Saturday slot are my own suggestions. They build on my plan's re-run phase and on the Saturday lean (1.54, interval 0.98 to 2.5), and neither is proven.
The 30-Post Tracker
Copy these columns into a sheet. The first seven match the audit sheet below, so you can reuse the same sheet for both.
Date | First line | Lane | Media (text/image/carousel/video) | Likes at day 3 | Link in body (yes/no) | Views at day 3 | Topic tag | Likes vs my median
Fill in the last column once you have 10 posts. Compute your median likes, then divide each post's likes by it.
The Decision Rules
| If this happens | Do this |
|---|---|
| A post beats your median twice using the same format | Add that format to your rotation |
| A post beats your median once | Treat it as one lucky draw and try again |
| A re-run earns about half of the original | That matches my case study of one high-volume account. It is not a measured constant, so judge each re-run against your median |
| Media posts beat your text posts | Raise your media share |
| You posted a link in the body and the post did worse | Move links to your bio and compare again |
| A lane stays below your median after 10 posts | Reframe it or drop it |
Daily 15-Minute Routine
Cheatsheet 2: Threads Profile Audit Sheet (For an Existing Account)
Use this when you already have posts. Expect about 30 minutes. It turns my report into a test you run on yourself.
Step 1: Collect the Last 30 Posts
Make a sheet with these columns:
A: Date
B: First line
C: Lane
D: Media (text / image / carousel / video)
E: Likes
F: Link in body (yes / no)
G: Views
Fill in 30 rows. These are the first seven columns of the tracker in Cheatsheet 1. Use posts at least three days old, just as I did, because younger posts are still collecting likes.
Step 2: Run the Within-You Test
These formulas follow my report's method: the median with the tactic plus 1, divided by the median without it plus 1. My report computed that ratio for each writer and then summarized across writers. Your sheet gives you the ratio for one writer, you. Row 1 holds the column names, so your data starts in row 2.
Overall median likes:
=MEDIAN(E2:E31)

Median likes with media:
=MEDIAN(FILTER(E2:E31,(D2:D31<>"text")*(D2:D31<>"")))

Median likes, text only:
=MEDIAN(FILTER(E2:E31,D2:D31="text"))

Media ratio (any media against text):
=IFERROR((MEDIAN(FILTER(E2:E31,(D2:D31<>"text")*(D2:D31<>"")))+1)/(MEDIAN(FILTER(E2:E31,D2:D31="text"))+1),"not enough posts")

Link ratio (with a link against without):
=IFERROR((MEDIAN(FILTER(E2:E31,F2:F31="yes"))+1)/(MEDIAN(FILTER(E2:E31,F2:F31="no"))+1),"not enough posts")

Share of posts with media:
=(COUNTA(D2:D31)-COUNTIF(D2:D31,"text"))/COUNTA(D2:D31)
These formulas use FILTER, which works in Google Sheets and Excel 365. A ratio above 1 means the tactic earned more than your usual. With 30 posts the answer is noisy, so look at direction and repeat it next month.
Step 3: Score the Profile
Tick each row. The thresholds are my rules of thumb, and they are not tested cutoffs.
| # | Check | Pass looks like | Grade | Pass? |
|---|---|---|---|---|
| 1 | Media share | More than half your posts carry an image, carousel or video | Holds for any media | |
| 2 | Links in the body | Zero | Holds | |
| 3 | Lane | You can name one lane in a sentence, and most of your 30 posts fit it | Your call | |
| 4 | Lane strength | If you post about AI, your lane sits in the top half of my lane table, or you have a reason to stay | Holds in part | |
| 5 | Money pitch | Your hooks do not lead with making money | Holds in part | |
| 6 | Your median | You know your median likes and you compare each post with it | Sound method | |
| 7 | Winners | You can name what your top 3 posts share | Sound method | |
| 8 | Hashtag stuffing | None. At most one topic tag | Holds | |
| 9 | Hook formulas | You do not rely on a formula you copied | Not shown | |
| 10 | Asks | One ask or none, and no repost begging | Not shown | |
| 11 | Volume | You added posts only if each one held your median | Not shown | |
| 12 | Replies | You answer comments, in your own time | Your call |
Rows 9 to 11 are "Not shown". If you skip them, nothing in my data says you lose. I would fix rows 1, 2 and 6 first.
Step 4: Read Your Insights Like an Analyst
Open threads.com/insights, choose "Last 30 days" and fill in this table. The right-hand column shows my own numbers from the screenshots above, so you can see how each line works.
| Metric | Formula | My last 30 days |
|---|---|---|
| Views | Overview card | 249,062 |
| Viewers | Overview card | 173,093 |
| Non-follower share of viewers | (Viewers minus follower viewers) / Viewers | about 99.9% (109 followers, 172K non-followers) |
| Interaction rate | Interactions / Views | 0.78% (1,948 / 249,062) |
| Net followers per 1,000 viewers | Net followers / Viewers x 1,000 | 0.59 (102 / 173,093) |
| Share of views from your latest 10 posts | Sum of views on the latest 10 / Views | 0.3% (793 / 249,062, the ten latest posts) |
| Top 3 communities | "Top interests and communities" | AI Threads, Tech Threads, Design Threads |
| Busiest windows | "Most active times" | Sun, Fri and Sat, 5:30 PM to 8:30 PM (GMT+5:30, my time zone) |
How to use it:
Step 5: Decide
| Finding | Next 30 days |
|---|---|
| Media share under half and media posts beat text | Add media to the next 10 posts |
| Any post with a link in the body | Move the link to the bio or test it in a reply |
| One lane clearly beats the rest | Make it 70% of your posts |
| A single post was most of your reach | Re-cut it in a new media type, expect about half the result |
| Conversion is very low | Rewrite the bio, pin your clearest proof and name your lane |
| You changed too many things at once | Change one thing for 10 posts, then compare medians |
The One-Page Audit Summary (Fill In and Keep)
Account: [HANDLE]        Date: [DATE]        Posts audited: [N]
Median likes: [X]        Median with media: [X]        Median text only: [X]
Media ratio: [X]         Link ratio: [X]        Media share: [X]%
Lane: [LANE]             Lane fit: [X] of 30 posts
Insights: views [X], viewers [X], non-follower share [X]%, interaction rate [X]%, net followers per 1,000 viewers [X]
Top 3 posts and what they share: [NOTES]
One thing to change for the next 10 posts: [CHANGE]
Re-audit on: [DATE 30 DAYS OUT]
The Threads Prompt Pack: 14 Copy-Ready Prompts
I built these prompts around what survived my testing: pick a subject that can show something, attach media, keep links out of the post body, and judge every post against your own median. You can paste them into ChatGPT, Claude or Gemini.
Each prompt has three parts:
Five Rules Before You Paste Anything
Group A: Set Up Your Account
Prompt 1: The Lane Picker
You are a Threads strategist who works from evidence and says when evidence is thin.

My background: [YOUR SKILLS, JOB OR HOBBIES]
Things I can show on screen or camera: [DEVICES, CODE, DESIGNS, RESULTS, TOOLS I USE]
Audience I want to reach: [WHO THEY ARE AND WHAT THEY STRUGGLE WITH]
Time I can spend each week: [HOURS]

Task: Suggest 5 lanes (subjects) for my Threads account.

Rules:
1. Favor lanes where one post can show something real, such as a device, a screen of code, a generated image or a result. Lanes that only describe a method or promise an outcome rank lower.
2. For each lane give me: a one-sentence description, 3 post ideas that each include a visual, and the proof I would need to show.
3. Rank any lane built on "make money" promises last.
4. Do not claim any lane will earn a certain number of likes or views. Write "unknown" when you do not know.
5. End with one recommended lane and one backup. Give a two-sentence reason for each.
Paste: your skills, what you can show, and your audience.
Evidence: Holds in part. Inside the AI pass, lane medians ran from 110.5 likes (hardware and devices) down to 14 (make money with AI), a 7.9 times spread. My lane table covers AI subjects only, so for other topics this prompt applies the same idea: a post that shows something.
Prompt 2: The Bio and Pinned Post Builder
Write 5 Threads bio options and a pinned-post plan for my account.

Who I am: [ONE SENTENCE]
My lane: [LANE]
Who I help: [AUDIENCE]
One proof point I can show: [RESULT, PROJECT, SCREENSHOT OR NUMBER I CAN VERIFY]
What I want people to do after they follow: [ACTION, FOR EXAMPLE VISIT MY SITE]

Rules:
1. Each bio is one or two short lines. It says what I post and who it helps.
2. Use plain words. No buzzwords, no "guru", no income promises.
3. Use only the proof point I gave you. Do not add numbers or claims.
4. Suggest which bio link goes first. I can add up to five links.
5. Pinned-post plan: describe the one post I should pin, what image or carousel it needs, and the first line. Keep links out of the post body.
Paste: your one-line identity, your lane and one verifiable proof point.
Evidence: Your call. My data cannot observe bios. I include it because my own Insights show 0.059% of viewers followed me, so a clear bio is the cheapest conversion test I know.
Group B: Create Posts
Prompt 3: The 30-Day Media-First Calendar
Build a 30-day Threads content calendar for me.

Lane: [LANE]
Audience: [AUDIENCE]
Things I can show: [SCREENSHOTS, DEMOS, RESULTS, PHOTOS, TOOLS]
Posts per week I can keep up: [NUMBER]
My best-performing past posts (paste first lines, or write "none yet"): [LIST]

Return a table with these columns:
Day | Post idea | Media type (image, carousel, video or text) | What the media shows | First line | Topic tag (one only) | Link in body (always "no")

Rules:
1. At least two of every three posts carry an image, carousel or video.
2. Include at least 6 carousels, one idea per card.
3. No outbound link in any post body.
4. Every 7th post re-cuts my best earlier post into a different media type. If I wrote "none yet", re-cut the strongest idea from my first 6 posts instead.
5. Mix at most 2 posts per week from any single post format.
6. Do not promise results. Do not write fake statistics or fake testimonials.
Paste: your lane, what you can show, and past winners if you have any.
Evidence: The media rule holds (any media 1.98 times the same writer's text posts, 95% CI 1.38 to 4.61, 95 writers). The "two of three" ratio and the six carousels are my rules of thumb, so treat them as a starting point. Carousels led within writers at 1.73 (95% CI 1.3 to 3.18), but the sign test did not reach significance (p = 0.068, adjusted p = 0.52), so I call that suggestive. Re-cutting a post into another media type is untested.
Prompt 4: The Carousel Builder
Turn this idea into a Threads carousel.

Idea: [IDEA OR POST DRAFT]
Audience: [AUDIENCE]
Proof or example I can show: [SCREENSHOT, RESULT OR DEMO]

Rules:
1. Card 1 states the point in under 10 words. No trick, no vague teaser.
2. Cards 2 to [NUMBER, 5 TO 8] each carry one step or one fact.
3. Last card names one action for the reader.
4. For each card, give the on-image text (under 15 words) and a note on what visual goes behind it.
5. Write a caption of two short sentences. No outbound link in the caption.
6. Do not add facts I did not give you.
Paste: a rough idea and the proof you have.
Evidence: Among posts with at least 200 likes, carousels earned 10.3 reposts per 100 likes against 5.7 for text. That figure is pooled, so treat it as a lean. Carousels also led the within-writer media comparison at 1.73, though the sign test did not reach significance. Threads allows up to 20 items per carousel.
Prompt 5: The Image Hook Text Writer
I will post a single image on Threads. Write the text that sits on the image and the caption under it.

What the image shows: [DESCRIBE IT]
The point I want to make: [ONE SENTENCE]
My voice: [THREE ADJECTIVES, FOR EXAMPLE DIRECT, DRY, WARM]

Give me:
1. 5 on-image text options of 8 words or fewer.
2. 3 captions of 1 to 3 short sentences each. Each caption adds something the image does not say.
3. For each option, one line on what the reader should notice first.

Rules: plain words, no clickbait, no outbound link, no claims I cannot prove.
Paste: a description of the image and the one point you want to land.
Evidence: Your call. Single images (1.32) did not beat the same writer's text posts on their own, and my data could not test on-image text. Meta says video, photo and carousel posts that include text average more views than those without, which is about adding context in the caption.
Prompt 6: The Link-Free Post Rewriter
Rewrite this Threads post so it works without an outbound link.

Original post: [PASTE POST]
What the link points to: [PAGE OR PRODUCT]
What I want readers to do: [ACTION]

Give me:
1. The post rewritten so it delivers its full value inside Threads.
2. A one-line bio-link label that points to the page.
3. An optional follow-up reply that adds one more useful detail. No link.
4. A list of what you cut and why.

Rules: keep my voice, do not shorten the key facts, do not add claims.
Paste: a post you planned to publish with a link.
Evidence: Holds. Posts with an outbound link earned 0.30 times the same writer's other posts (95% CI 0.13 to 0.73), roughly 70% fewer likes. I also cannot say whether a link in a reply avoids the cost, because I did not collect replies, so the prompt keeps replies link-free.
Prompt 7: The First-Line Picker
Write 8 versions of the first line of this Threads post, then pick the clearest one.

Post idea: [IDEA]
Audience: [AUDIENCE]
What the media shows: [IMAGE, CAROUSEL OR VIDEO DESCRIPTION]

Rules:
1. Each version uses a different shape: a plain statement, a number, a result, a question, a contrast, a short story opener, a how-to, and a warning.
2. Each version is under 20 words and says exactly what the post delivers.
3. No fake urgency, no "you won't believe", no promise of secrets.
4. Do not invent numbers, results or names in any version. Use only what I gave you.
5. Pick the clearest version and explain the pick in one sentence. Pick for clarity, not for cleverness.
Paste: your post idea and a description of the media.
Evidence: Not shown. Opener types were flat within writers, so ask the model for the clearest line and stop polishing. Treat this as a short step.
Prompt 8: The Topic Tag Chooser
Suggest the single best topic tag for this Threads post.

Post: [PASTE POST]
My lane: [LANE]

Give me 5 candidate tags. For each one, list:
- the tag text (1 to 50 characters, no periods or ampersands)
- whether it is a broad or narrow tag (say clearly that you cannot see live tag activity)
- a one-line reason it fits

Then recommend one tag. If you are unsure whether a tag is active, say so.
Paste: the finished post and your lane.
Evidence: Your call. Meta's internal data says posts with tagged topics generally get more views. The Threads API accepts one topic tag per post. My own test measured hashtag-style captions (1.06 to 1.12 within writers), which is a different thing.
Group C: Measure Like an Analyst
Prompt 9: The Own-Median Analyzer
You are a careful data analyst. I will paste my last [NUMBER, 20 TO 30] Threads posts. Use only the data I give you.

Columns: Date | First line | Lane | Media (text, image, carousel, video) | Likes | Link in body (yes or no) | Views

[PASTE TABLE]

Tasks:
1. Compute my median likes across all posts. Show the sorted list you used.
2. Compute my median likes for posts with media and for text-only posts.
3. Compute a media ratio: (median likes with media + 1) / (median likes for text + 1).
4. Compute a link ratio the same way: (median with link + 1) / (median without link + 1).
5. Compute my median likes per lane. Skip any group with fewer than 5 posts and write "too few".
6. List my 3 best posts and the traits they share. Mark each trait as a pattern or as a coincidence.

Rules:
- Show every number you used so I can check it in a spreadsheet.
- If a figure cannot be computed from my data, write "unknown". Never invent data.
- Add one caution: with this few posts, results are noisy, so treat them as directions.
Paste: the 30-row table from Step 1 of the audit sheet.
Evidence: Sound method. The +1 ratio is the one I used within writers. Check the model's math with the sheet formulas in the audit cheatsheet, because language models can slip on arithmetic.
Prompt 10: The Post-Mortem
One of my Threads posts beat my median. Help me work out why without fooling myself.

My median likes: [NUMBER]
This post: [PASTE POST AND DESCRIBE THE MEDIA]
Its likes at day 3: [NUMBER]   Its views at day 3: [NUMBER]
Posted on: [DAY AND TIME, WITH TIME ZONE]
Posts around it that did not win: [PASTE 3 FIRST LINES AND LIKES]

Tasks:
1. List 5 possible reasons it won (subject, media, clarity, timing, luck, outside shares and so on).
2. For each reason, name one thing in my data that supports it and one thing that argues against it.
3. Tell me which reasons I can test with my next 10 posts, and how.
4. Remind me that a re-run often earns less than the original. My own working guess is about half.
5. Do not credit one cause with certainty. Rank causes as "likely", "possible" or "cannot tell".
Paste: the winner, your median and three losers from the same period.
Evidence: Sound method. Likes concentrate in a few posts (the top 1% of posts held 34.3% of all likes), so one winner tells you little. My revised plan says to expect the second airing to earn less. The "about half" figure comes from my case study of one high-volume account, not from the 12,045 posts.
Prompt 11: The Re-Run Planner
Plan a re-run of my best Threads post.

Original post: [PASTE]
Media type used: [TYPE]
Likes at day 3: [NUMBER]   My median: [NUMBER]
Date posted: [DATE]

Give me 3 re-run options. Each one must change one variable only:
A. same idea, different media type
B. same media type, fresh first line
C. same idea, new example or new proof

For each option, give me: the new post draft, what I am testing, how I will judge it (compare with my median, and expect less than the original), and when to measure.

Rules: do not copy the original word for word. No outbound link in the body.
Paste: your best post and its numbers.
Evidence: Your call for the re-cut itself, which my report could not test. Judging the result against your own median is Sound method. The "about half" figure comes from my case study of one high-volume account, so treat it as a planning guess and not a measured constant.
Prompt 12: The Insights Interpreter
Read my Threads Insights numbers and tell me what to test next. Use only what I paste.

Period: [LAST 30 DAYS, DATES]
Views: [N]    Viewers: [N]    Followers among viewers: [N]
Interactions: [N]    Net followers: [N]
Daily views pattern (describe the chart: spikes, long tail, flat): [DESCRIPTION]
Top countries (viewers): [LIST WITH PERCENTAGES]
Top communities: [LIST]
Most active times: [LIST]
Posts in this period: [NUMBER]   Best single day of views: [N]

Tasks:
1. Compute: interactions / views, net followers / viewers x 1,000, non-follower share of viewers.
2. Say what each figure suggests, in one sentence, and mark each as "directional" or "cannot tell".
3. Look at the chart description. Did a few days drive most of the views?
4. Give me 3 tests for the next 30 days. Each test changes one variable and has one metric to watch.
5. Do not give me benchmarks you cannot source. If you cite an outside number, name its source and date.
Paste: the numbers from the Overview, Viewers and Followers tabs of threads.com/insights.
Evidence: Sound method. My own run produced 0.78% interactions per view, about 0.6 net followers per 1,000 viewers, and 99.9% non-follower viewers.
Prompt 13: The Advice-Claim Tester
I will paste a piece of Threads growth advice. Turn it into a test I can run on my own account.

Advice: [PASTE THE CLAIM, FOR EXAMPLE "POST QUESTIONS TO GET MORE REPLIES"]
Where I heard it: [SOURCE OR "NOT SURE"]
My median likes: [NUMBER]
Posts per week I can make: [NUMBER]

Tasks:
1. Restate the claim as something measurable (for example "posts that open with a question earn more likes than my other posts").
2. Say what data would support it and what data would argue against it.
3. Design a test using my own posts: which 10 posts use the tactic, which 10 do not, and what I keep the same (lane, media, time of week).
4. Tell me what result would change my mind, and what result means "no difference".
5. Name the main trap: a claim can look strong across many accounts and vanish inside one account. Explain how that applies here.
6. Warn me if the claim sounds like a secret, a guarantee or a number with no method behind it.
Paste: any advice you see, from a thread, a course or a tweet.
Evidence: Sound method. This is the logic of my whole report: compare a writer with their own other posts. In my study, Simpson's paradox made several pooled winners disappear once I compared within a writer.
Group D: Talk to Your Audience
Prompt 14: The Comment-Reply Drafter
Draft replies to the comments on my Threads post, in my voice.

My post: [PASTE]
My voice (paste 3 past replies I liked): [EXAMPLES]
Comments:
[PASTE COMMENTS, ONE PER LINE]

Rules:
1. Write one reply per comment, under 40 words.
2. Answer the question or add one detail that already appears in my post. Do not just say thanks. Do not add claims I did not make.
3. No outbound links, no begging for follows or reposts, no sales pitch.
4. Flag any comment that needs a human decision (a complaint, a claim I should check, a hostile comment).
5. Suggest one follow-up post idea based on the most common question.
Paste: your post, three replies you wrote before and the comments.
Evidence: Your call. Buffer found that replying to comments was linked to about 42% higher engagement across 128,000 Threads posts, and Buffer treats that as correlation. Meta also says replies make up almost half of views. My own data could not test replying.
A Weekly Rhythm for the Pack
| Day | Prompt | Time |
|---|---|---|
| Monday | 3 (calendar) or 4 (carousel) | 20 minutes |
| Tuesday to Friday | 5, 6, 7 and 8 as the day's post needs them | about 10 minutes per post |
| Every day | 14 (replies) on your latest post | 5 minutes |
| Sunday | 9 (median), then 10 or 11 on the winner | 20 minutes |
| First of the month | 12 (Insights), 13 (test a claim you keep hearing) | 30 minutes |
What These Prompts Cannot Do
Frequently Asked Questions (FAQs)
What content goes viral on Threads?
In my 4,247 mature posts, only 8.7% reached 1,000 likes, and the top 1% of posts held 34.3% of all likes. The biggest levers I measured were subject (a 7.9 times spread across AI lanes inside one collection pass, although within writers only AI coding held up) and media (any media earned 1.98 times the same writer's text posts). Opener formulas, formatting tricks and calls to action were flat within writers. My sample covers AI posts, so treat the lane ranking as a method and not as a rule for every niche.
Do hashtags or topic tags work on Threads?
Meta says posts with tagged topics generally get more views, based on its internal data. The Threads API accepts one topic tag per post. In my corpus, hashtag-style captions were flat within writers (1.06 to 1.12), which measures typed hashtags and not the official tag feature. I would use one relevant tag and skip the rest.
What is the best time to post on Threads?
The sources point to different slots. Buffer analyzed 2.5 million posts and found Thursday at 9 a.m. local time peaks, while Meta says posting more on weekends can drive engagement. My data leaned Saturday (1.54, interval 0.98 to 2.5), which cannot rule out no effect. Check "Most active times" in your own Insights, then test two slots across 10 posts each.
How often should I post on Threads?
Meta recommends at least 2 to 5 posts a week. A BlackTwist analysis of 21,864 posts called 5 to 6 posts a week the sweet spot for median follower growth, though it only counted creators with 100 or more followers and 1,000 or more views. My data did not show that more posts raise your typical post. Pick a pace you can keep with media attached, and check that your median holds as you add posts.
Do links hurt reach on Threads?
Posts with an outbound link earned 0.30 times the same writer's other posts in my data (95% CI 0.13 to 0.73), which is about 70% fewer likes. Adam Mosseri said in November 2024 that links are not downranked but people rarely like them, and in June 2025 that links were working much better. Likes are not reach, so I cannot separate a penalty from low interest. I would keep links in the bio, where Meta allows up to five.
Can a small account go viral on Threads?
Yes, but do not plan around it. A 20-follower account in my sample reached 18,617 likes with a carousel, yet small accounts look strong in my data only because search found them through their hits. My own Insights show that 99.9% of 173,093 viewers were non-followers, so Threads does show small accounts to people who do not follow them. Only about 6 of every 10,000 viewers followed me, which tells me reach and audience are different problems.
Final Thoughts
Nearly half of the claims I published in August failed my own test once I compared each writer with themselves, and another group could not be tested at all. What survived was plain: pick a subject that can show something, attach media, keep links out of the post body and judge every post against your own median. Open the Audit Sheet above today, run it on your last 30 posts, change one thing for the next 10 and audit again in 30 days. If you want the full tables and the method, read the full report at promptslove.com.