
 Chrome Extension
I scraped and studied 21,864 public, English-language AI-related X tweets, posts from January 1 to August 24, 2026.
I wanted to know what the posts people actually liked and saved had in common, especially when the account was not already enormous.
The answer was more interesting than a list of “viral hooks”: the same post shape can look good for reach and poor for saves, and a measurement mistake can reverse a result entirely.
This is a field guide to what I found, what I would test on my own account, and what I would refuse to claim from this data. You can download my complete 135-page research report for the methods, tables, tests, objections, and appendices.
The important limit: Every post in my sample came from a high-engagement search. I compared posts that had already cleared a like threshold. I did not collect a representative sample of all posts, so I cannot tell you the probability that your next post will go viral or promise that any format causes more reach.
Key takeaways
First, what I actually collected
I started with 1,134 planned query combinations across AI-related search terms, month windows, and like floors. Of those, 689 were executed and 448 returned at least one post in the final corpus. That produced 21,864 unique posts from 7,829 accounts, dated January 1 through August 24, 2026. (Report, pp. 26–28, 35–36, 102–106)
The query design matters more than the headline sample size. The search used a “Top” ranking, English-language filter, reply exclusion, and minimum-like thresholds beginning at 200. Only part of the planned term grid was reached. This is a study of selected successful AI posts, not all AI posts, all X posts, or all posts from these authors. (Report, pp. 26–28, 35–36)
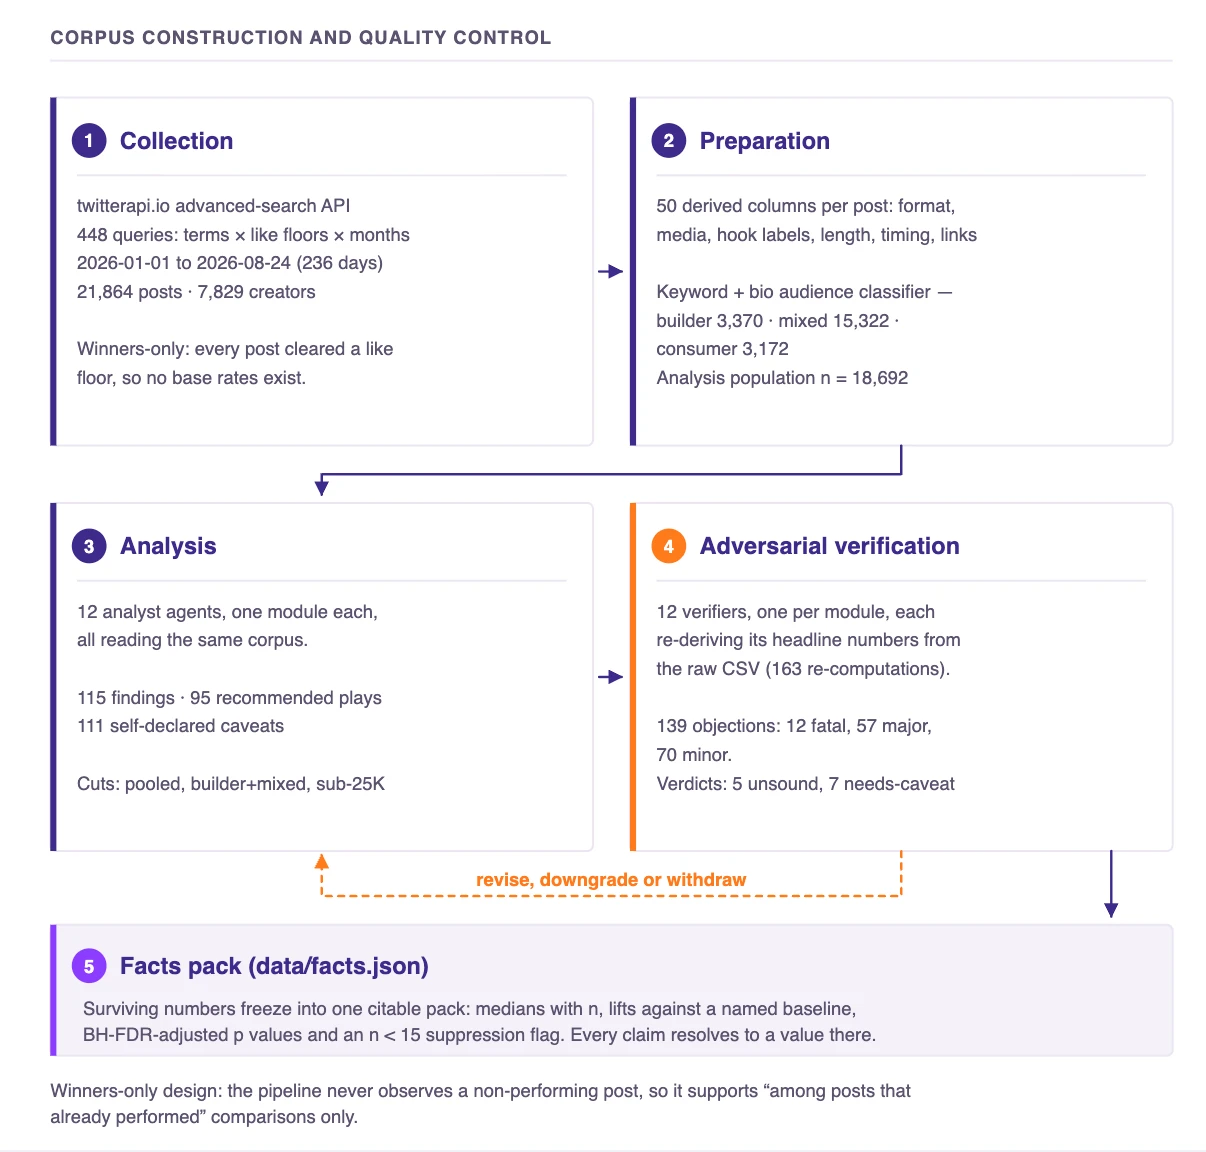
Chart 1. Collection pipeline. The final corpus has 21,864 posts. The builder-coded-plus-mixed analysis subset has 18,692, and its under-25K-follower stratum has 6,521. Source: full report, methodology and population tables.
| Population I discuss | Posts | What it means | What it does not mean |
|---|---|---|---|
| Full corpus | 21,864 | High-engagement English AI-related posts returned by the search design | All X posts or a random sample |
| Builder-coded | 3,370 | Posts assigned a builder label by rules | 3,370 verified developers |
| Consumer-coded | 3,172 | Posts assigned a consumer label by rules | All consumer AI conversation |
| Mixed | 15,322 | Posts that did not fit either rule cleanly | A validated audience segment |
| Builder-coded plus mixed | 18,692 | Main practitioner-leaning analysis population | 18,692 confirmed practitioners |
| Under 25K followers | 6,521 | Smaller-account slice of that analysis population | Evidence for new accounts with no audience |
These labels came from pattern rules, not hand-reviewed identities. In the project code, the biography rule also reads a field that is empty in the stored records, while most biographies are stored under another field. That makes the “builder” label especially fragile. I therefore use builder-coded, consumer-coded, and mixed, and I do not turn those labels into claims about a person’s profession. (Report, pp. 29–31, 107–113)
The same caution applies to “thread” and “demo.” They are inferred from text and media rules. A “demo” in this dataset can be a video, image, or carousel, so I will not pretend every one was a screen recording. (Report, pp. 29–31, 107–113)
Why I do not call this a recipe for virality
Imagine I search only for restaurants with a line outside the door. I can compare what those restaurants serve, but I cannot calculate the chance that a new restaurant will draw a line. I have excluded the quiet restaurants by design.
That is the central selection problem here. The report itself calls it “winners-only” sampling. No amount of extra charts can recover the missing ordinary posts, failed posts, or posts blocked by the search design. (Report, pp. 94–99)
There is another practical limit: the data records public engagement snapshots, not the author’s actual business outcome. X distinguishes public likes, replies, reposts, impressions and bookmarks from owner-only clicks and total engagements. A bookmark is not a measured return visit. A view is not a unique person, as X’s own view-count explanation makes clear.
X-Virality-Research-Report-Promptslove.pdf
2.1 MB
The distribution was unequal even among winners
The median post had 996 likes. The mean was roughly 4,087. That gap is what a heavy upper tail looks like: a comparatively small number of posts pull the mean upward. I counted 89,346,465 likes across the corpus at the captured snapshots. (Report, pp. 36–39)
The top 1% of sampled posts received 25.8% of sampled likes. The top 5% received 53.1%. The top 10% received 67.1%. Across creators, the top decile collected 70.9% of likes. Those are concentration measures inside this selected corpus, not market-wide shares. (Report, pp. 37–39)
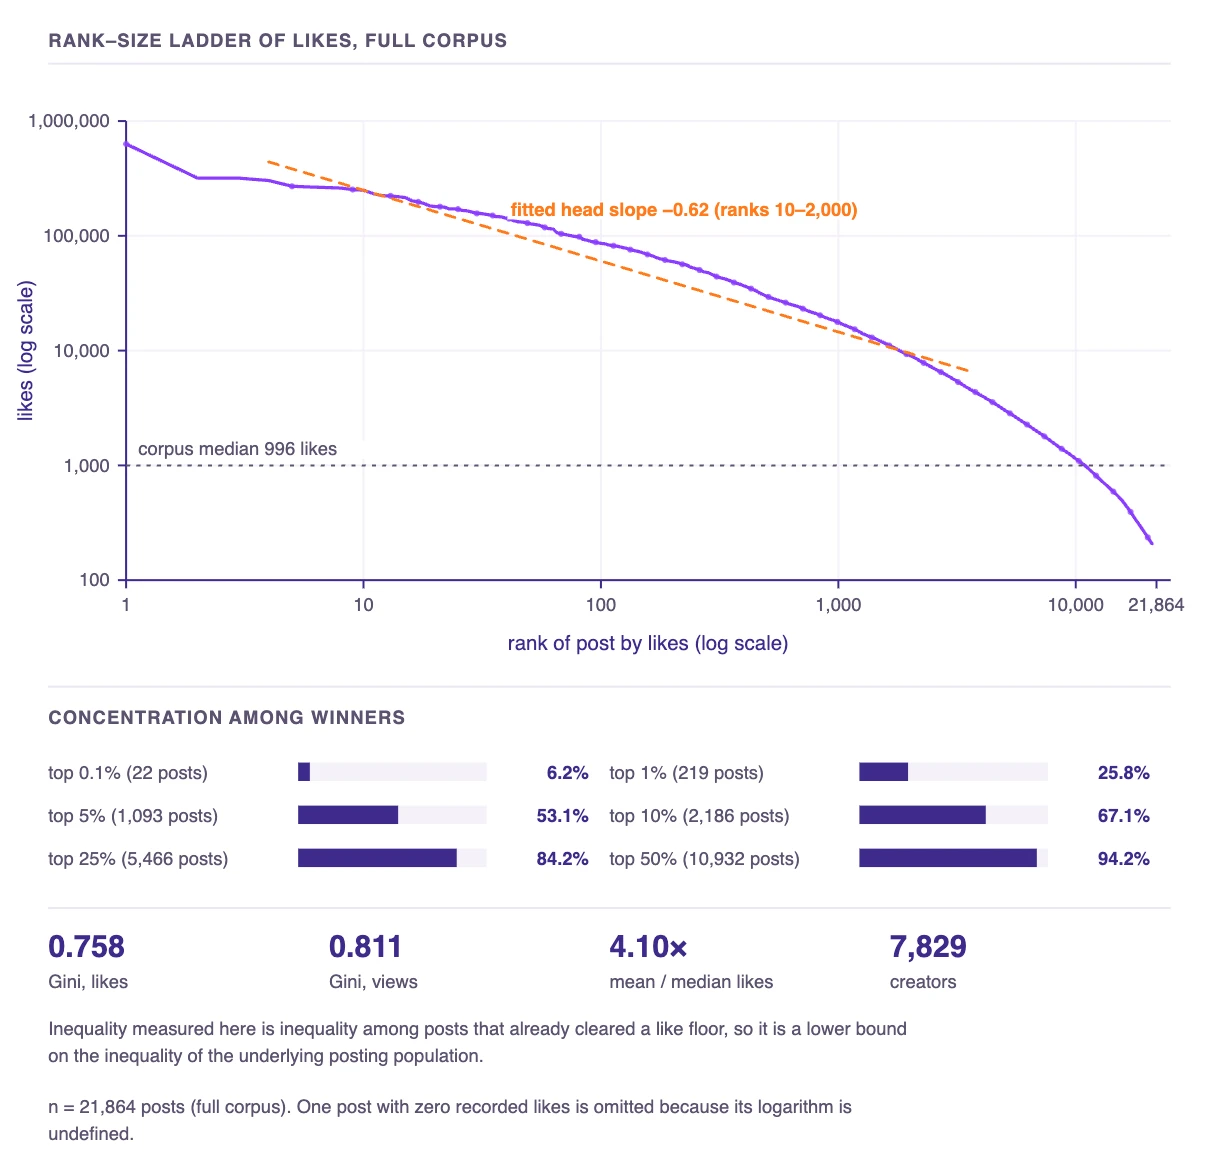
Chart 2. The sample has a long engagement tail. This is a rank-size chart, not a fitted claim that X follows a particular power-law mechanism. Source: full report, distribution chapter.
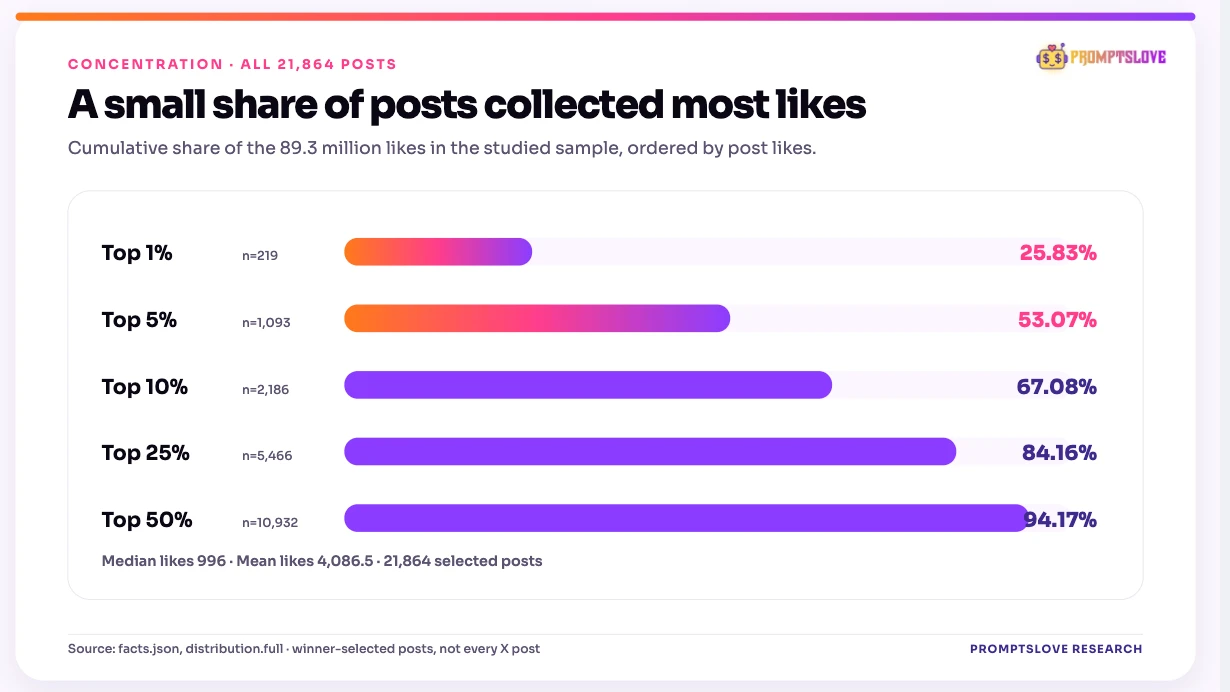
Chart 2b. Share of sampled likes captured by the most-liked sampled posts. Source: full report, distribution chapter.
My lesson is not “copy the top ten posts.” The higher the tail, the more misleading a handful of screenshots becomes. I use medians, sample sizes, follower bands, and multiple outcomes before I turn any pattern into a draft.
There were two different games hiding inside “AI content”
One result changed how I read every later chart. Consumer-coded AI chatter got a much higher median like count than builder-coded posts: 2,011 against 716. Builder-coded posts had much higher median bookmarks: 845 against 218. (Report, pp. 17, 39)
That does not mean the people in one group are better writers. The topic, audience, authors, and classifier all differ. It does mean that “What gets liked?” and “What gets saved?” are different editorial questions.
| Heuristic segment | Posts | Median likes | Median bookmarks | Median bookmarks per 100 likes* |
|---|---|---|---|---|
| Consumer-coded | 3,172 | 2,011 | 218 | 7.4 |
| Builder-coded | 3,370 | 716 | 845 | 131.6 |
The last column is the median of each post’s bookmark-to-like ratio multiplied by 100. It is not median bookmarks divided by median likes, and it is not a conversion rate. A value above 100 is possible. Source: report, segment comparison.
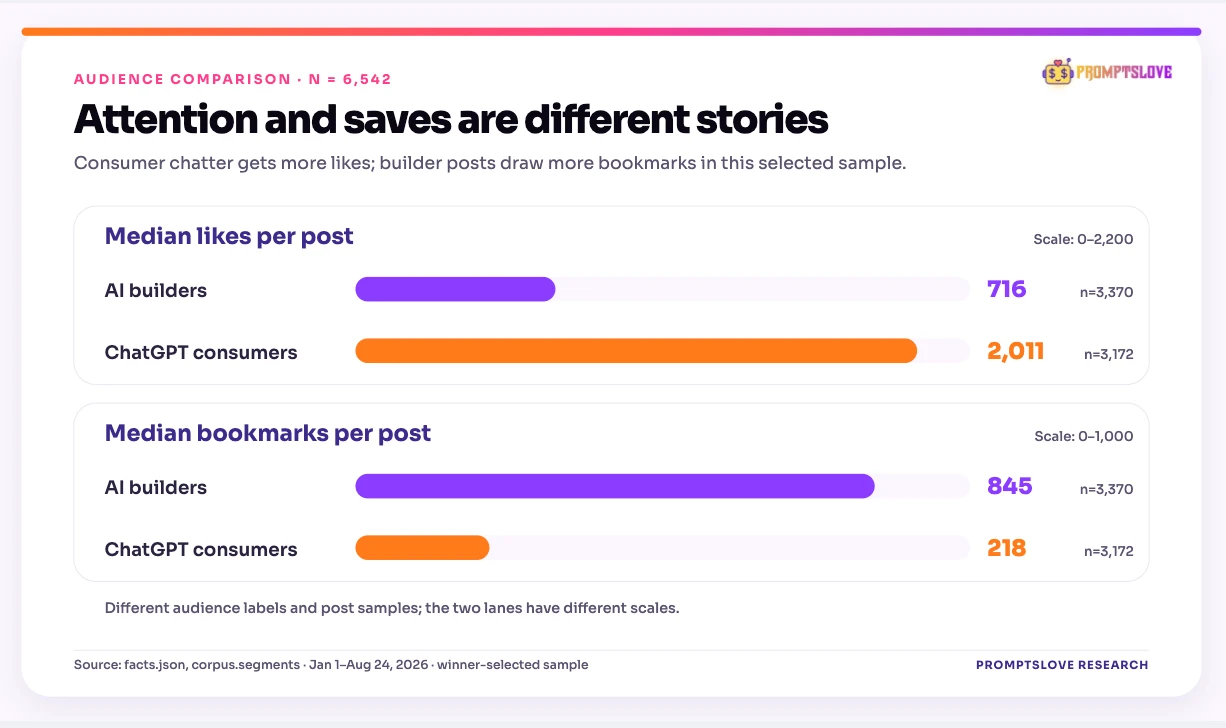
Chart 3. Different outcomes, separate scales. The audience labels are heuristic; this chart does not identify an effect of changing your audience. Source: full report, segment comparison.
I think of these as two jobs:
If you sell a product, a useful reference post may matter more than a joke with ten times the likes. My dataset cannot prove that, because it does not connect posts to trials, purchases, or attributed website visits. It does tell me not to use likes as the only score.
Account size changes the answer
Follower count and format choice are tangled. Large accounts have different audiences and can afford different production styles. In my builder-coded-plus-mixed subset, posts from accounts below 1,000 followers had a 584-like median; those from accounts above one million followers had a 2,128-like median. That is a descriptive comparison, not the return to adding a follower. (Report, pp. 45–47, 68–69)
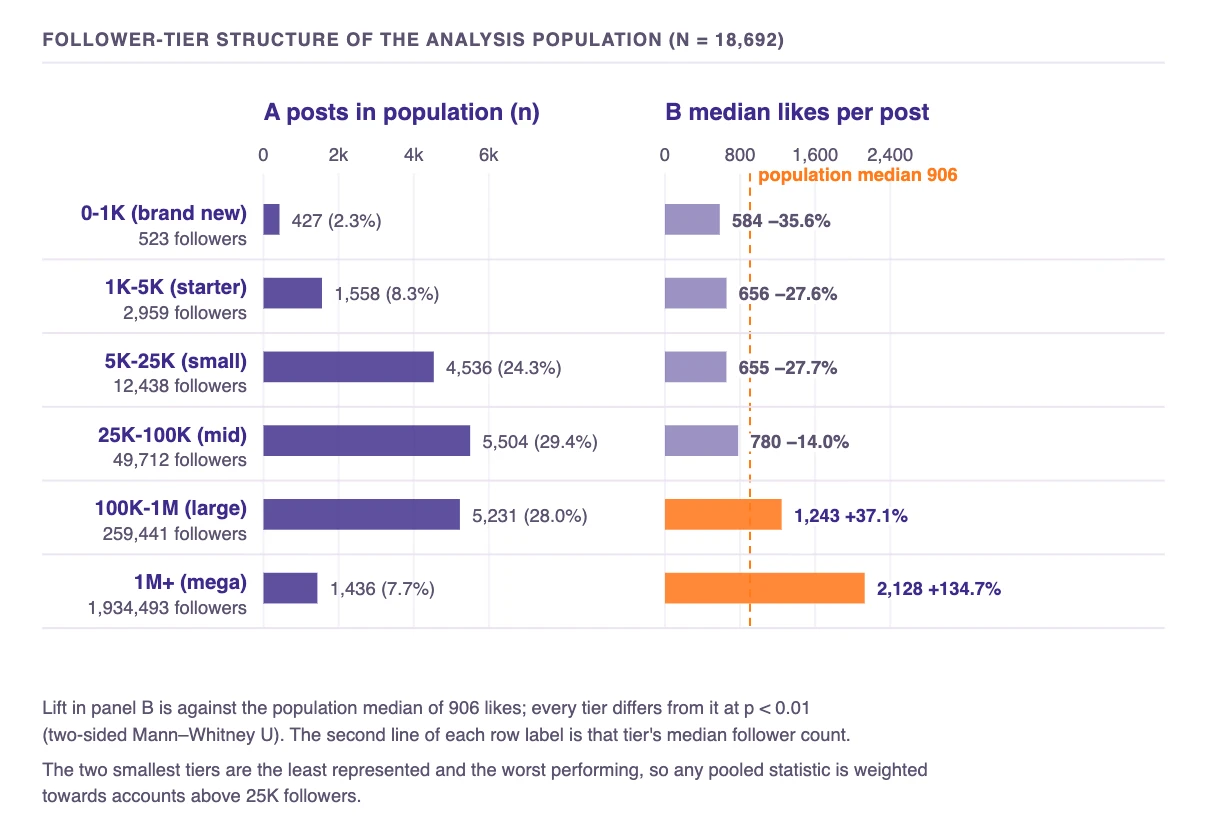
Chart 4. Follower-tier composition and median likes for the 18,692-post analysis population. Source: full report, follower-tier table.
If your account has 8,000 followers, the pooled result is not your result. I would start with the under-25K stratum, then test whether the pattern holds on your account.
Here is the clearest example:
| Coded format | Builder-plus-mixed posts: median-like lift vs 906.5 baseline | Under-25K posts: median-like lift vs 650 baseline | Under-25K sample |
|---|---|---|---|
| Demonstration | +0.4% | +58.2% | 201 |
| Carousel | +7.7% | −17.2% | 308 |
| Video | +34.0% | +37.7% | 1,190 |
| Thread | −19.8% | −20.3% | 2,387 |
| Quote | +26.6% | +62.5% | 334 |
These are median comparisons against each population’s own baseline, not estimated causal lifts. The carousel’s under-25K likes result sits near the report’s significance cutoff, so I would not declare “carousels hurt reach.” Source: report, format tables.
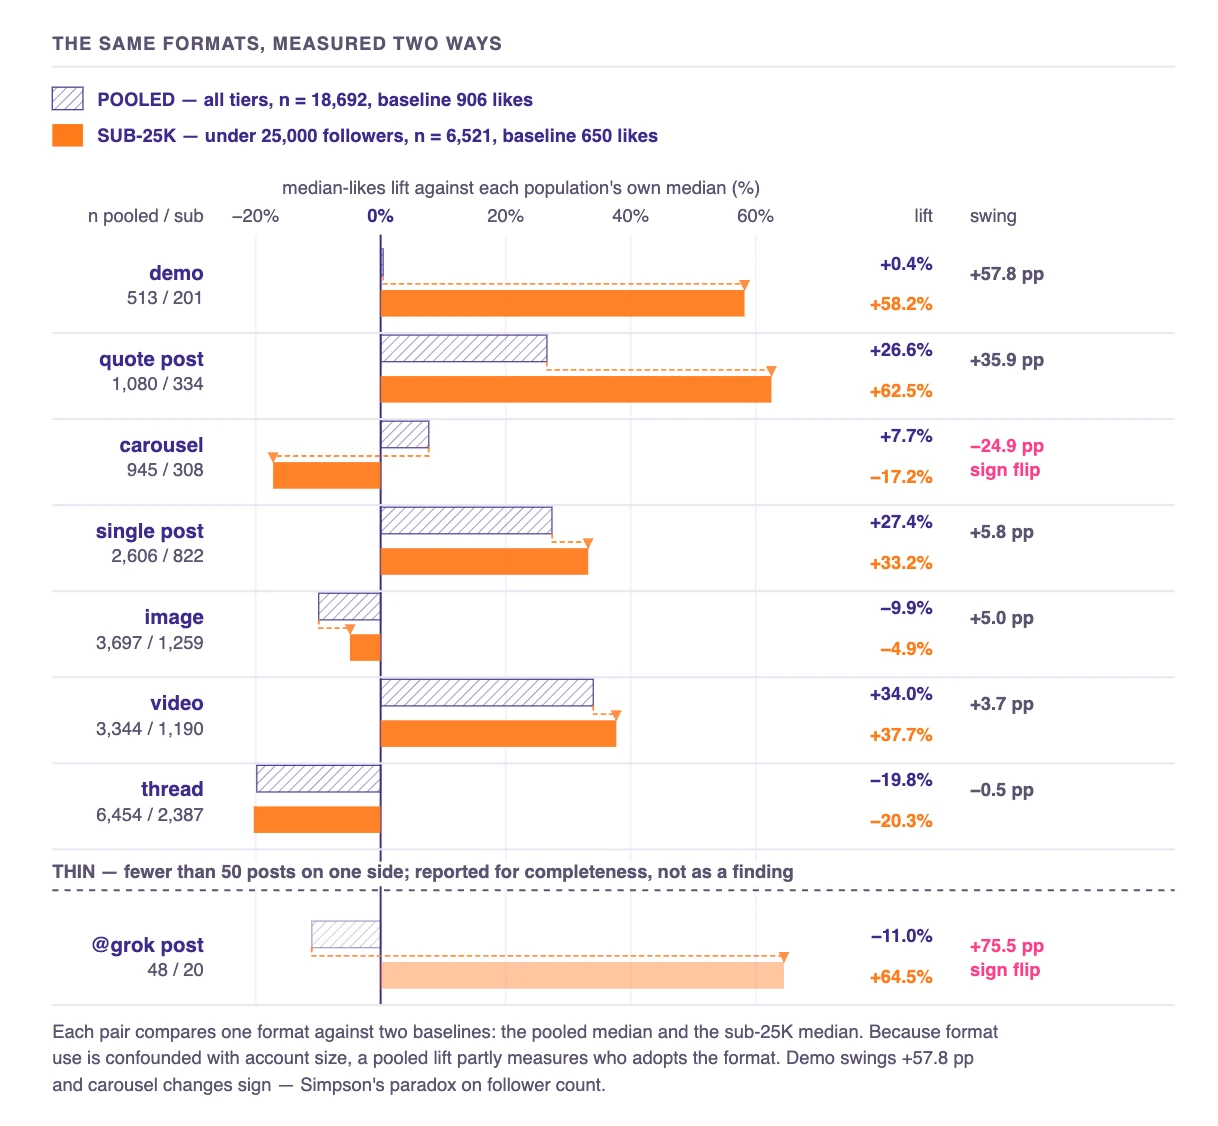
Chart 5. The same format can look different after conditioning on account size. Source: full report, format comparison.
I would not treat “video wins” as a command either. A video post can differ from a text post in creator skill, topical news value, visual proof, time spent making it, and the audience it reaches. The format number bundles all of that together.
One real post from the sample
Here is a real example, not a mockup. @OpenDesignHQ’s May 18, 2026 X post introduces an Open Design workflow inside Codex and includes a video demonstration. The account had 16,410 followers when my collection recorded it, so it entered the under-25K slice and was coded as a demonstration. The saved row recorded 2,027 likes, 2,585 bookmarks, and 470,432 platform-reported views at retrieval. (Study post record and format definitions)
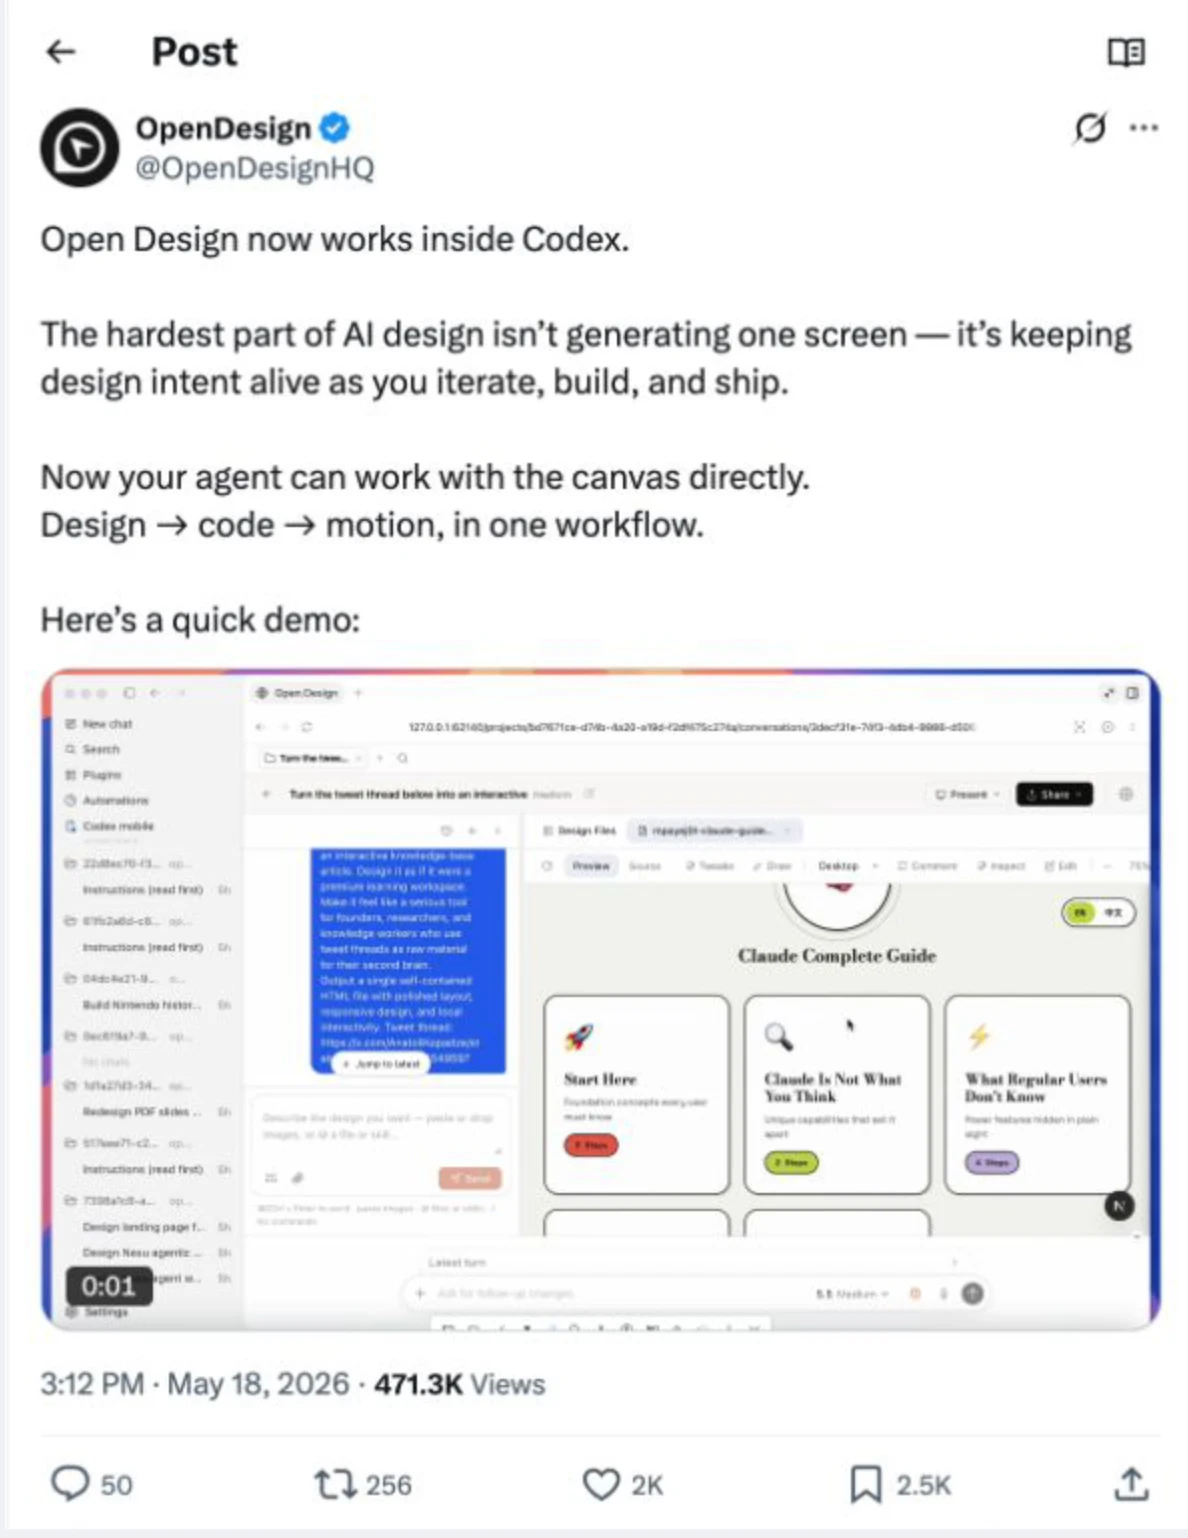
Actual X screenshot, captured September 22, 2026, of the original @OpenDesignHQ post. Live counts had changed by the capture date. This is an attributed editorial example of a coded format, not evidence that the format caused the outcome, and not an endorsement of Promptslove by the account.
What I notice is concrete: the post names the product, explains what changed, identifies the user problem, and shows the workflow rather than asking the reader to imagine it.
I can use that as an idea for a test. I cannot use one screenshot to estimate the average value of video, demonstrations, product announcements, or this particular writing style.
If you reuse someone else’s post in commercial promotion, check the rights and permissions first. X’s developer policy places limits on redistribution and promotional uses of X content. My downloadable report contains aggregate findings, not a downloadable corpus of other people’s posts.
The reach lane and the save lane
The under-25K format table is more useful when I put likes and bookmarks on separate axes:
| Coded format | Posts | Median likes vs under-25K baseline | Median bookmarks vs under-25K baseline | My reading |
|---|---|---|---|---|
| Quote | 334 | +62.5% | −46.1% | More reach-oriented in this sample |
| Demonstration | 201 | +58.2% | +290.2% | Strong save signal, reach result needs label validation |
| Video | 1,190 | +37.7% | +87.9% | Positive on both measures in this table |
| Single-post format | 822 | +33.2% | −37.3% | Reach-oriented coded format |
| Thread | 2,387 | −20.3% | +8.9% | More reference-oriented, modest save lift |
| Carousel | 308 | −17.2% | −22.5% | Neither metric above the stratum baseline here |
Baseline: 650 median likes and 347 median bookmarks across 6,521 builder-coded-plus-mixed posts from accounts under 25,000 followers. “Demo” and “thread” are inferred labels. This table describes sampled posts, not treatment effects. Source: report, Table 9.1 and surrounding discussion.
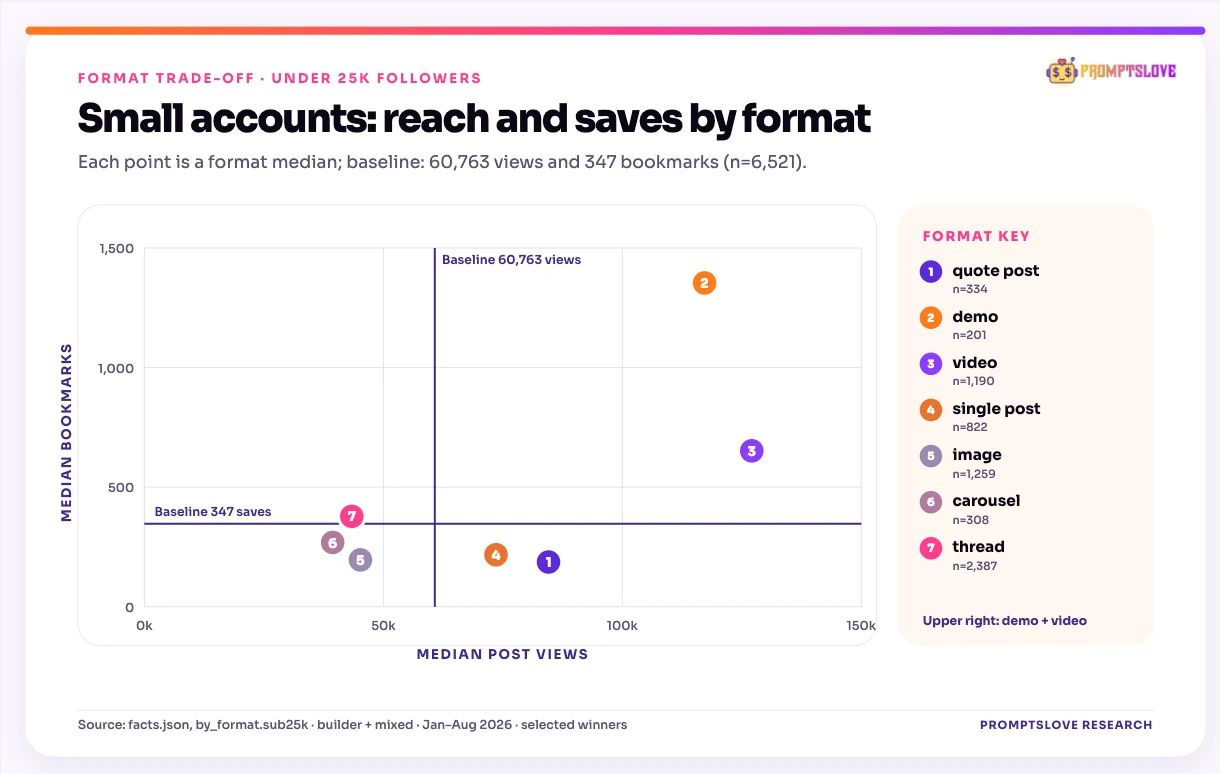
Chart 6. Both demonstration-coded posts and video posts are above the stratum baseline on likes and bookmarks in the table. The report’s prose says “only” demonstration, but that sentence conflicts with its own table and figure; I use the numbers rather than repeat the sentence. Source: report, Table 9.1.
There is a second warning inside the demo result. When I use a broader keyword flag for demonstrations instead of the narrow format label, the bookmark association remains large at +180.3%, but the like association is +11.5% and is not statistically distinguishable under the report’s stated testing procedure. I would be more confident that demonstration-like posts in this corpus were saved than that they had a special reach advantage. (Report, p. 88)
How I would draft for reach
For a reach-oriented post, I would try to make the first line specific enough that someone knows what changed without opening a thread. The study found a positive association for naming a specific tool in the first line, but the tool itself may be the news. I would treat the following as a draft pattern, not a discovered formula:
Draft pattern: “I used [named tool] to solve [specific problem]. Here is the result I got, the one thing that surprised me, and the part you can verify.”
I would attach visual proof only when it adds proof. I would not shorten the post until it loses the useful part, or strip a necessary link solely to chase likes. If my objective is a site visit, the link and its clicks matter more than maximizing an on-platform like count.
How I would draft for saves
For a reference-oriented post, I would make the artifact worth returning to: a checklist, reusable comparison, exact steps, template, or demonstration with enough context to repeat it. “Save this” is not the value. The value is that someone could actually use the post next week.
Draft pattern: “Here are the six decisions I made to get [specific result], the settings I used, what failed, and the checklist I would use next time.”
This is also where I would accept that a longer post might receive fewer likes while attracting more bookmarks. The dataset showed posts above 400 words in the under-25K group at 16.9% below the stratum median on likes but 21.6% above it on bookmarks. That does not tell me a long post is better for my business; I would still measure follow-on actions. (Report, pp. 50–51, 88)
The tempting middle is not automatically safer
The report’s 51–200-word bands did not sit neatly between the two lanes. In this selected sample, those bands were below the under-25K median on likes and roughly flat or below on bookmarks. That is a descriptive reason to make a post’s job explicit before drafting, not a reason to ban medium-length writing. (Report, pp. 90–92)
Length, line breaks, and what the first line does
The sharpest length contrast in my sample is easy to misunderstand. In the under-25K group, 1–25-word posts had a median 1,380 likes, 112.4% above the 650-like stratum baseline, but bookmarks were 12.0% below the 347-bookmark baseline. Posts above 400 words had 16.9% fewer median likes and 21.6% more median bookmarks than the same baseline. (Report, pp. 50–51, 88)
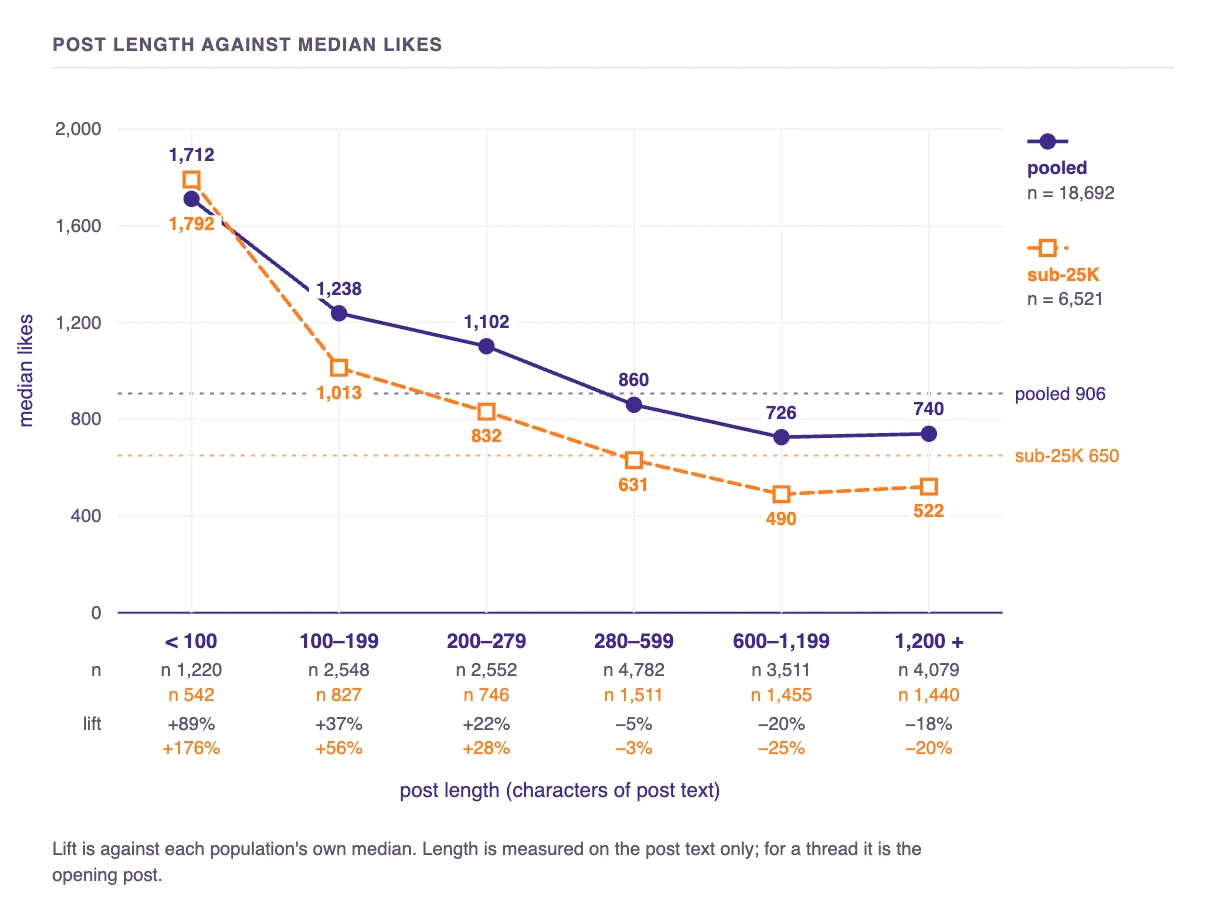
Chart 7. Length buckets and median likes. Buckets include different authors, topics, and formats; the curve is not a word-count prescription. Source: full report, length analysis.
One-line posts in the same stratum had 170.7% more median likes and 37.2% fewer median bookmarks than posts with a line break. That is a stronger contrast than a generic “keep it short” slogan because it has both an upside and a cost. (Report, p. 88)
My practical rule is simple:
“Breaking” and other hooks are not magic words
The “Breaking / just launched” pattern looked dramatic in the pooled data: +105.8% median likes across 597 sampled posts. In the under-25K stratum it fell to +19.8% across 64 posts and was not significant under the report’s test. That sounds more like news value, account size, and topic interacting than a word that you can paste into every first line. (Report, pp. 54–57)
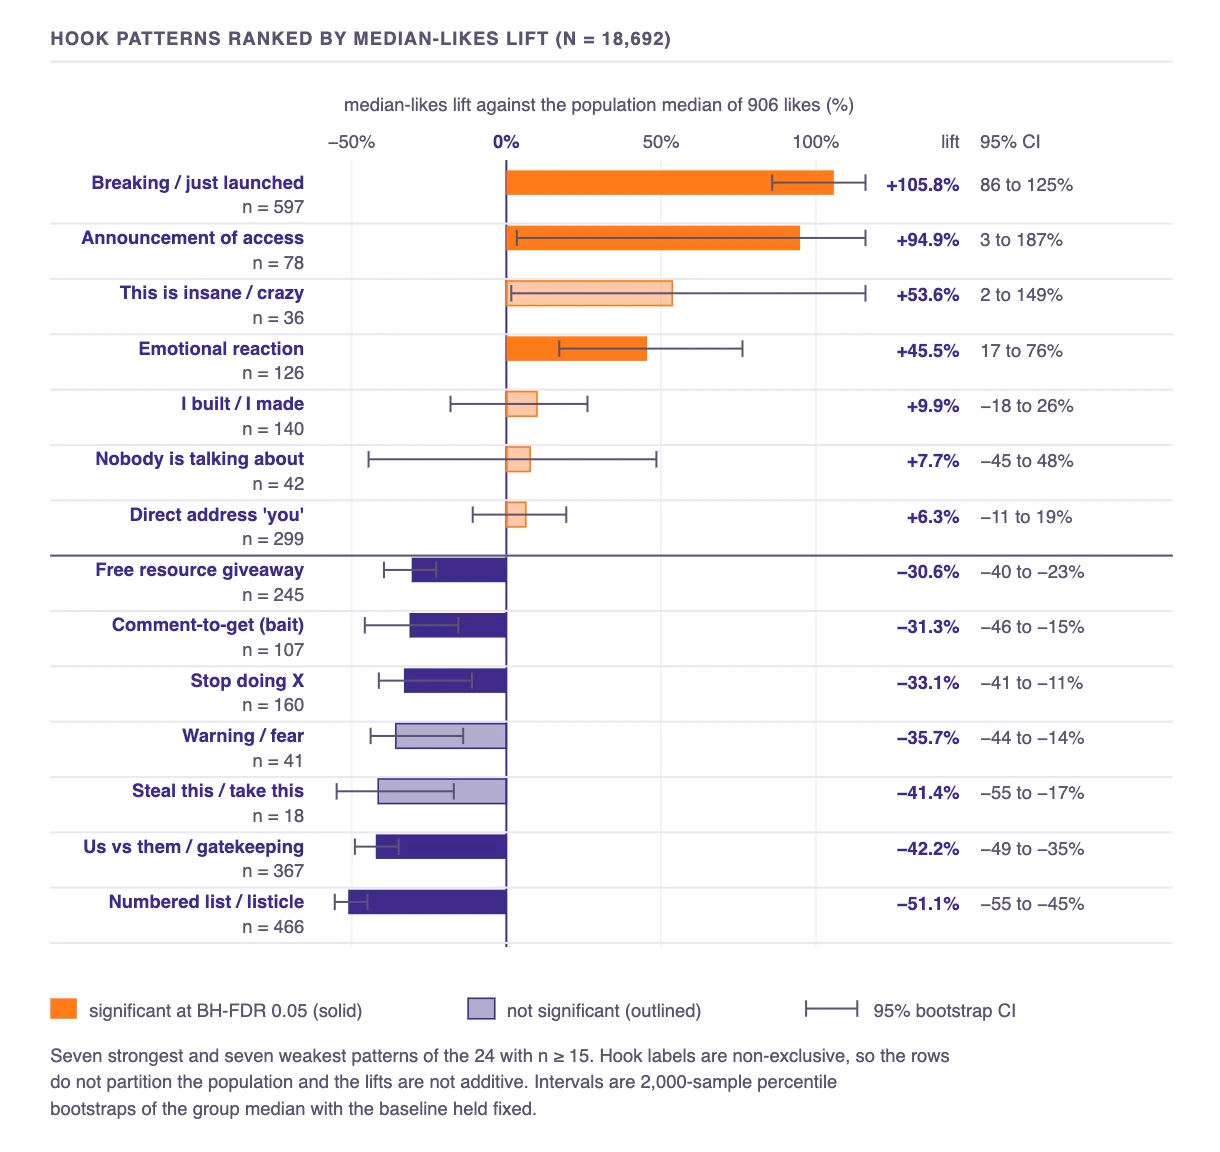
Chart 8. The hook chart is exploratory. Pattern groups can overlap, and the statistical correction applies inside the declared hook family, not across every comparison in the project. Source: full report, hook analysis.
By contrast, naming a specific tool in the hook appeared across 7,455 builder-coded-plus-mixed posts and corresponded to +28.4% raw and +29.6% follower-stratified median-like differences. In the under-25K group, the raw difference was +27.9% across 2,471 posts. I would test specificity, not force a brand name into a sentence where it does not belong. (Report, p. 60)
The report also found a negative association for a literal numeral as the first character in the first line, but a numeral anywhere in the post is a different feature. I would not turn that result into “never use numbers.” The useful editing question is whether the first line starts with meaning or with an unearned label like “7 tips.” (Report, pp. 61–62)
The outbound-link result that nearly fooled me
This is my favorite part of the research because it shows why a plausible chart can be wrong.
The first link flag was simple: if the post text contained “http,” call it a link post. It marked 8,058 posts and showed +9.9% median likes. At first glance, that seems to refute the familiar advice to keep links out of X posts. (Report, pp. 85, 128–129)
The flag was not measuring what I thought. X uses shortened t.co URLs for native media attachments, so a photo or video could be counted as a “link” even when it did not send the reader off-platform. The report found the naive flag on 48.2% of media posts but only 11.4% of text-only posts. It was partly picking up media. (Report, pp. 31, 85)
I re-derived the feature from URL entities and the destination host. Among the 2,626 posts with genuine off-platform links in the full corpus, median likes were 704 versus 1,046.5 for posts without them, a −32.7% raw difference. A follower-tier-weighted comparison reported −33.8%, with the direction negative in all six tiers. (Report, pp. 18, 31, 85, 128–129)
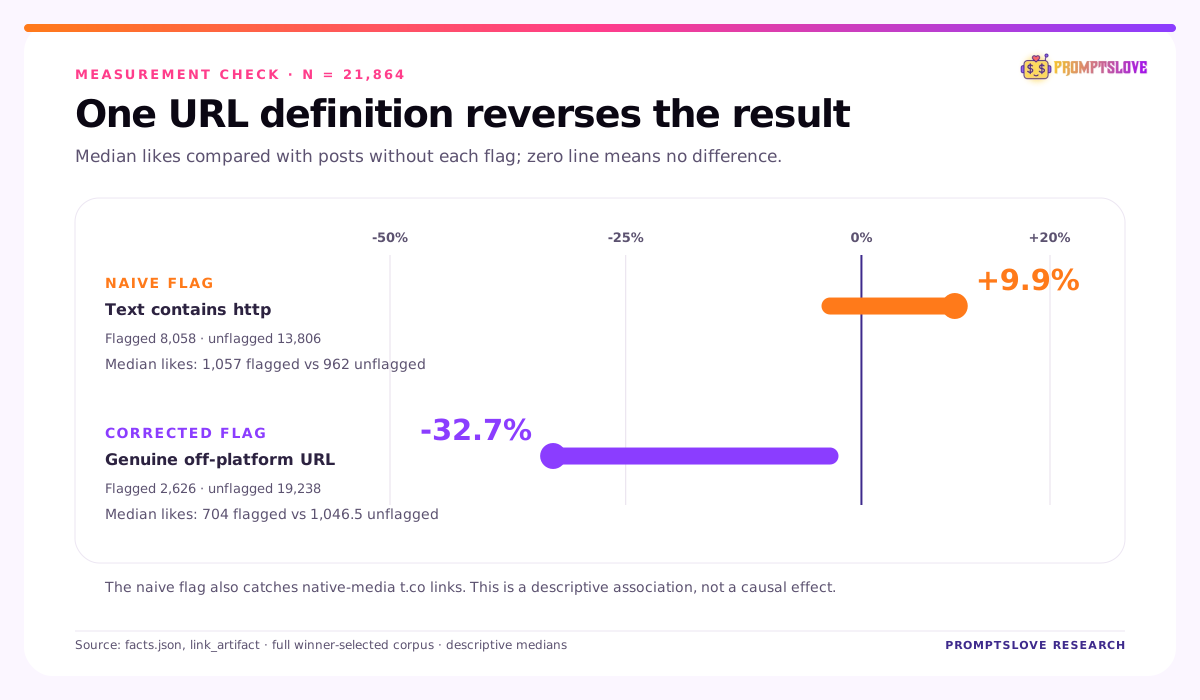
Chart 9. The sign changed when the measurement changed. The two bars use different definitions and different flagged populations, so their difference is a measurement lesson, not an estimate of the effect of editing a link into a post. Source: full report, link audit.
I will not call this proof that the X algorithm “punishes links.” Linked posts may differ in intent, topic, format, author, and audience. A matched analysis in the report found fewer views but more bookmarks for linked posts, which is consistent with several stories and does not isolate a ranking rule. X’s own explanation of the For You feed describes a personalized system with many signals, not a single public link multiplier. (Report, p. 31)
Here is how I would use the result:
Timing, tags, and the easy rules I would distrust
The report contains a weekday-by-hour heatmap. It shows median likes across the selected posts, indexed by Indian Standard Time. It does not know each account’s audience time zone, each post’s topical news cycle, or whether the same creator tried the same idea at different hours. It is a descriptive map, not a universal schedule. (Report, pp. 77–79)
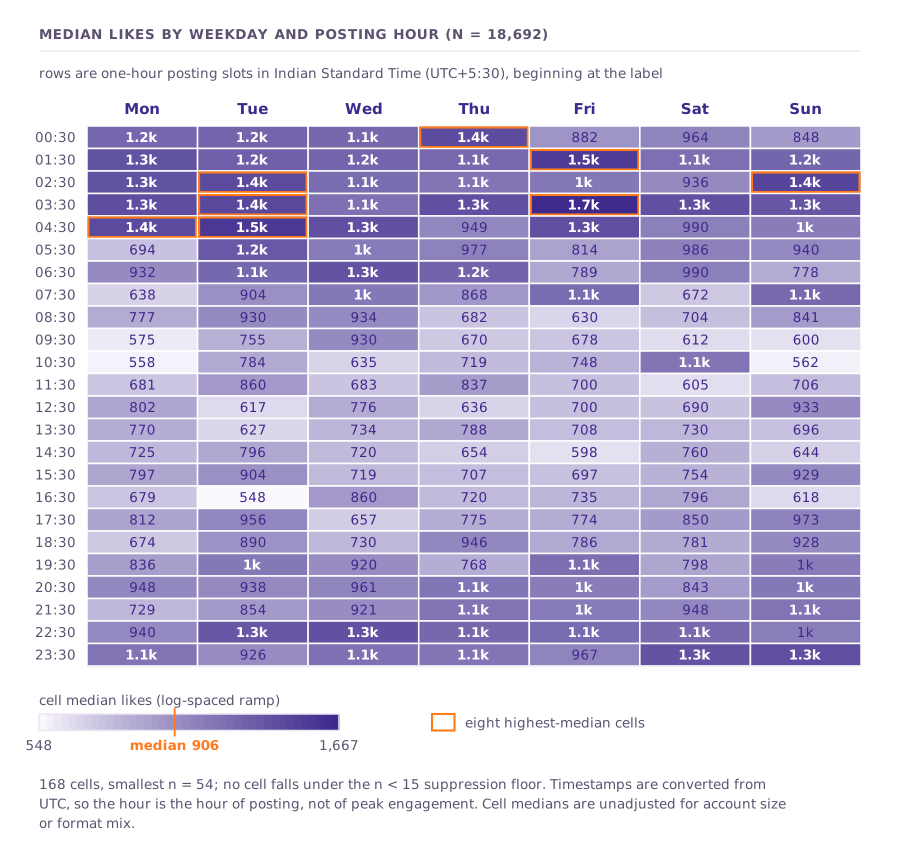
Chart 10. Unadjusted descriptive cells for the 18,692-post analysis population. The report’s graphic and caption disagree about whether these cells are follower-adjusted, so I treat the image as descriptive only. Source: report, timing section.
There are subtractive associations too. In the under-25K group, posts flagged with a hashtag were 35.0% below the stratum median on likes and 76.4% below on bookmarks, across 529 posts. Four or more emoji were 38.0% below on likes and 34.1% below on bookmarks, across 421 posts. Those are not experiments in which the same draft was randomly published with and without a tag or emoji. (Report, pp. 88–93)
I would cut decorative tags and emoji that add no information. I would keep a relevant hashtag when it serves a clear discovery or community purpose. X Business’s own creator guidance recommends relevant hashtags in moderation and genuine participation; neither its guidance nor my dataset establishes a universal best number for every account.
One more pattern worth watching: in the report’s under-25K sample, video’s median-like index relative to the same-period all-format median fell from 2.20 in January–April to 1.20 in May–August while video’s share of sampled posts rose from 13.9% to 21.0%. That could be changing supply, changing creators, changing topics, or changed sample composition. It is not proof that X reduced video distribution. (Report, p. 52)
What the verification pass made me remove
I had the findings challenged against the underlying data before turning them into recommendations. The report records 115 initial findings, 163 independent recomputations, and 139 objections: 12 fatal, 57 major, and 70 minor. Nineteen proposed recommendations were withdrawn. That was an internal adversarial pass, not independent peer review. (Report, pp. 18, 33, 80–87)
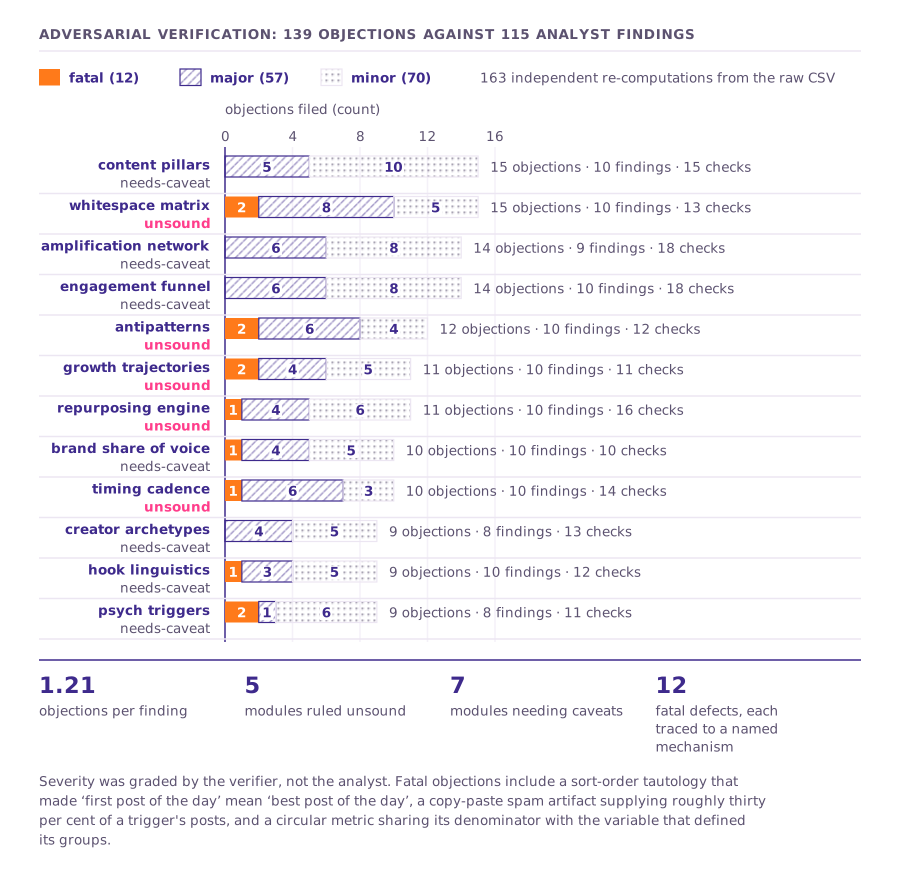
Chart 11. The audit found enough problems to change the advice. Counts describe the report’s internal process; they do not certify the remaining findings. Source: full report, verification chapter.
Three examples are worth carrying into your own analytics:
I also corrected the prose when it disagreed with the table: demonstration-coded posts were not the only under-25K format above both like and bookmark baselines. Video was too. If you download the report, read its tables and limitations alongside its narrative. (Report, Table 9.1)
I applied the ideas on my own X account for two weeks. What changed?
I began applying the study’s ideas to my @ramanpal account over the September 9–22, 2026 window. I checked my signed-in X Account Analytics overview on September 22 and compared it with the preceding August 26–September 8 window. September 22 was still in progress when I read the dashboard.
| X account metric | Aug 26–Sep 8 | Sep 9–Sep 22* | Change shown by X |
|---|---|---|---|
| Impressions | 3.2K | 20.7K | +529% |
| Engagements | 61 | 574 | +840% |
| Engagement rate | 1.8% | 2.7% | +49% |
| Profile visits | 5 | 43 | +760% |
| Replies received | 20 | 428 | About +2K% |
| Likes | 25 | 89 | +256% |
| Reposts | 1 | 4 | +300% |
| Bookmarks | 10 | 9 | −10% |
Source: the signed-in @ramanpal X Analytics dashboard, captured September 22, 2026. X displays impressions rounded to one decimal place in thousands, and the percentage change is the dashboard’s own comparison, not a recalculation from the rounded numbers. X describes its engagement rate as post engagements divided by impressions and “Replies” as replies received on my posts. These are my account metrics, not the research corpus metrics.
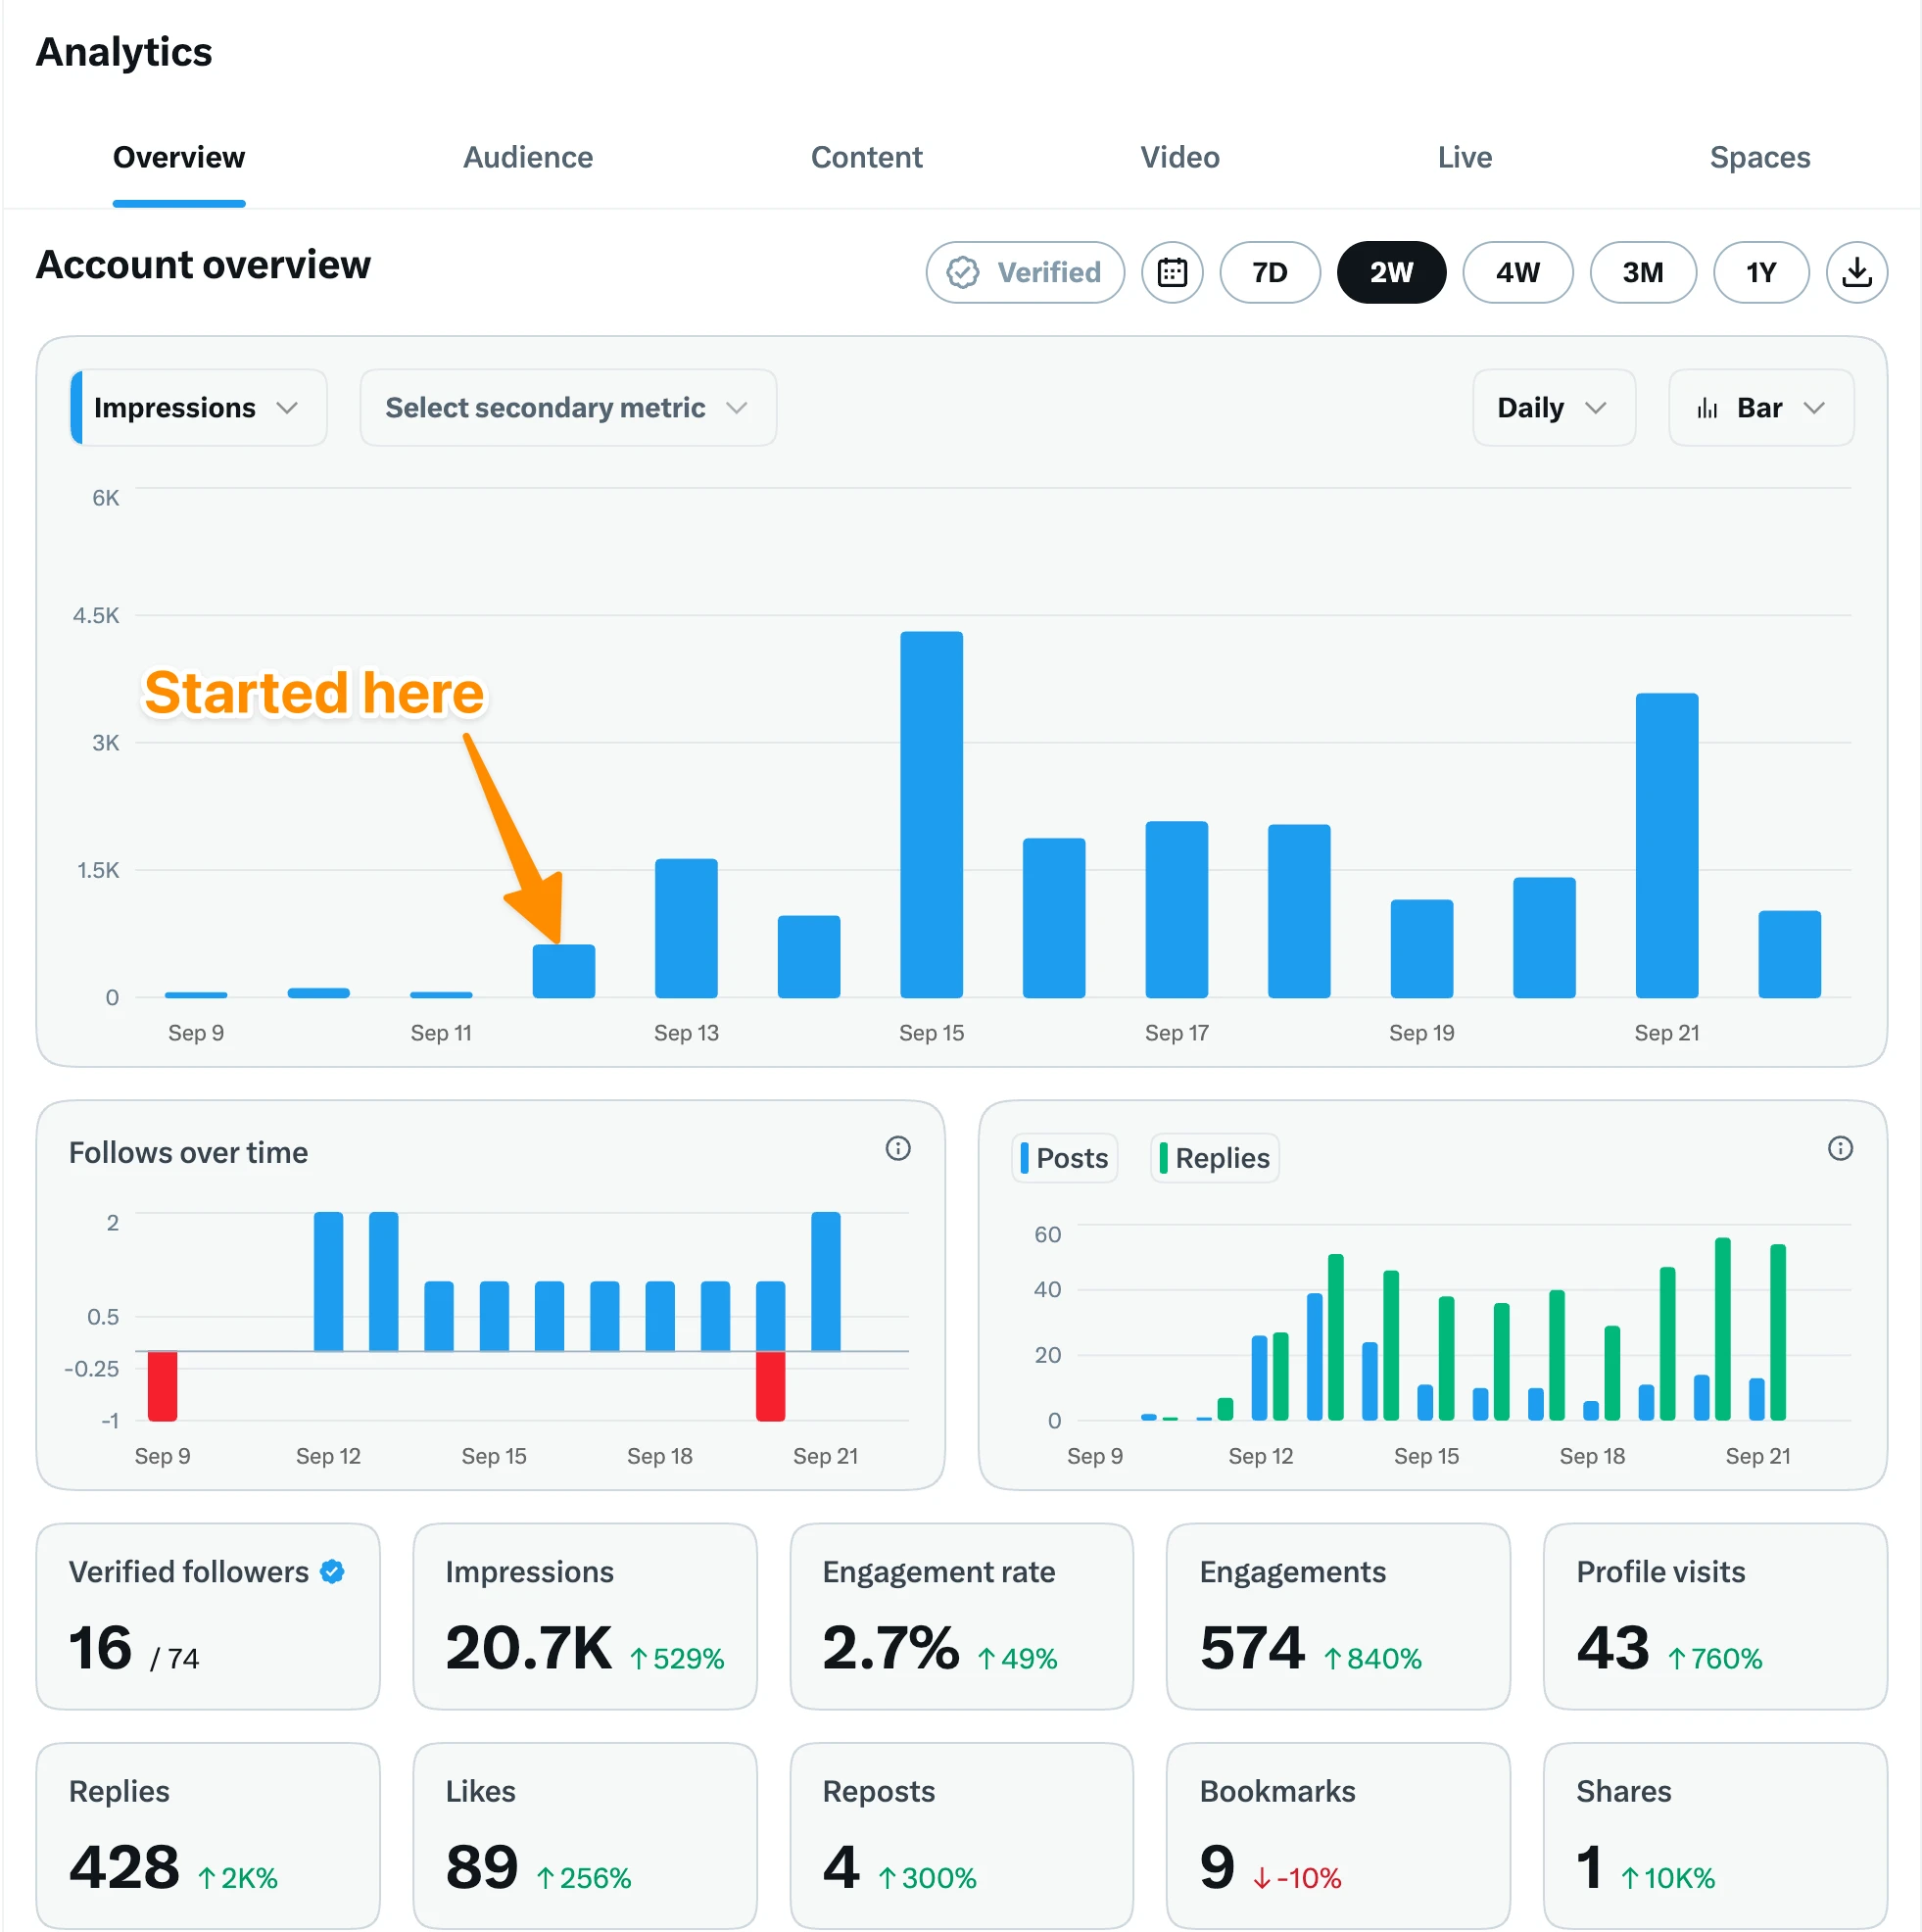
Chart 12. My account’s before-and-after snapshot. The newer window includes a partial September 22. This is a real account result while I was using the ideas, not a controlled test proving the ideas caused the change.
I am pleased with the increase in impressions, engagement, profile visits, and replies. I am just as interested in the exception: bookmarks went from 10 to 9. That is exactly why I split reach and reference value in the first place. If I only showed you the largest green percentage, I would hide the outcome that the save lane is meant to improve.
This comparison cannot separate the effect of my writing choices from changes in posting volume, reply activity, topics, news, follower growth, or a small number of unusually successful posts. The previous period was also a small baseline, so percentage changes look dramatic. I would call this a promising account snapshot and a reason to keep measuring, not validation of a causal playbook.
How I would test these ideas on your own account
You do not need to scrape 21,864 posts to run a better content experiment. You do need to decide what “working” means before you post.
Step 1: Pick one primary outcome per post
Choose reach if the objective is new people seeing an idea. Choose reference value if you want readers to save a process. Choose traffic if you need them to visit a page. Choose conversation if replies from the right people matter.
Write the primary outcome into the draft. If you choose traffic, do not later declare the post a failure because it earned fewer likes than a text-only post.
| Goal | Primary measure | Useful secondary measures | What not to substitute |
|---|---|---|---|
| Reach | Impressions or views at fixed post age | Likes, reposts, follows | Raw likes alone |
| Reference value | Bookmarks at fixed post age | Bookmarks per 1,000 impressions, later clicks | Likes as a proxy for return visits |
| Conversation | Relevant replies received | Distinct respondents, profile visits | Reply count without quality check |
| Site traffic | Your own link clicks and attributed visits | Signups, qualified sessions | On-platform engagement alone |
| Customer action | Trials, purchases, or leads with attribution | Conversion rate, quality | A high view count |
X’s API metric guide distinguishes public interaction counts from clicks and total engagement metrics available in the owner context. X’s view-count guide also cautions that views are not unique people. Use the native definitions when you compare your own posts.
Step 2: Build a fair baseline
Take your last 20–30 relevant posts if you have them. Label the date, topic, format, follower count at posting, and the post’s job. Record the same metric at the same post age, such as 24 hours and 72 hours. The exact window matters less than using it consistently.
Do not compare a four-month-old launch post with a post that has been live for six hours. Do not compare a reply that joined a trending conversation with a standalone product tutorial and call the difference “format.”
Here is the tracking sheet I would use:
post_url,published_at,topic,primary_goal,format,followers_at_post,impressions_24h,bookmarks_24h,likes_24h,replies_24h,profile_visits_24h,link_clicks_24h,notes
https://x.com/you/status/EXAMPLE,2026-09-23T09:00:00Z,product-demo,reference,video-demo,1000,,,,,,,sample row only
If an API or export does not supply one field, leave it blank instead of inventing a value. If a post is promoted, note it: X says public metrics can combine organic and promoted activity.
Step 3: Change one thing at a time
Over two to four weeks, alternate comparable posts from the same account. Keep topic, publishing cadence, and production effort as similar as you reasonably can.
For example, if you want to test first-line specificity:
This is an inference from the study’s limitations, not a claim the report ran that experiment. The cleaner test is within the same account, where at least the author and follower base are less different. Avoid mass posting near-identical variants or artificial engagement: X’s authenticity rules prohibit manipulative behavior.
Step 4: Keep a “why this might be wrong” column
For every apparent winner, write down the alternative explanation. Was there a product release? Did a larger account share it? Was a post older when measured? Did one format require three hours of extra production? Did you publish during a news event?
That column is not pessimism. It is the fastest way I know to stop a screenshot from turning into a rule.
A two-week publishing plan you can actually run
If I were starting from scratch tomorrow, I would not begin by choosing a “best time” or memorizing 100 hooks. I would pick a narrow audience, two post jobs, and a measurement routine.
Before day one
Write down the person you want to reach in a single sentence. For example: “I help solo developers get a working AI feature into production.” That is much more useful than “I post about AI,” because it tells you what would count as a helpful reference post and what would count as a timely reach post.
Pick two themes you can speak about from firsthand work. Make a small source folder for screenshots, before-and-after product states, data you have permission to share, and lessons you can explain. You are building a bank of proof, not a bank of phrases.
Create a baseline from your own past posts. If you have no history, write that down. A zero baseline does not justify claiming an infinite lift after one lucky post.
Days 1–7: establish the two lanes
Publish a small, sustainable mix:
I would not post just to fill the grid. The goal is enough comparable observations to learn something without diluting the account’s point of view.
At 24 and 72 hours, record the metrics for each post. Save a note on any unusual share, launch, news event, or collaboration. If you can attribute visits and signups on your site, track them too.
Days 8–14: repeat, then compare
Repeat the mix with similar topics and effort. Make one deliberate change, such as the specificity of the first line or whether a demo shows the workflow within the post. Avoid changing timing, topic, format, hook, and call to action all at once.
At the end, answer these questions in order:
If all you can say is “my impressions rose,” you have a useful observation. If you can say “within my account, similar posts assigned to two approaches had a persistent difference across several weeks,” you have a stronger one. You still have to watch for news, seasonality, and small samples.
A checklist for every post
How to read my charts without fooling yourself
This section is worth reading before you copy any tactic.
“Median lift” is a comparison, not a promise
When I say demonstration-coded posts were +58.2% on median likes in the under-25K stratum, I mean the median of those sampled posts was 58.2% above the median of that broader sampled stratum. I do not mean turning your next post into a demo will add 58.2% likes. The accounts, subjects, and production quality were not randomly assigned.
For some features, the report compares a present group to an absent group rather than to the overall population median. I label the baseline with each chart because the same-looking percentage can answer a different question.
A p-value does not repair a bad label
The report uses two-sided rank tests and controls false discoveries within declared feature families. That is useful discipline, but a tiny p-value cannot make a malformed link flag measure outbound links. Nor can it turn a heuristic “thread” into a verified conversation thread. (Report, pp. 29–33, 94–99)
The label audit matters. Among the full corpus’s 525 demonstration-coded posts, the project data classifies 396 as video, 108 as single image, and 21 as carousel. If someone summarizes this as “screen-recorded demos,” they are saying more than the data knows.
A viewer is not a unique person
I recorded more than 12 billion platform-reported views across the collected posts. That number is a sum of post-level snapshots, not 12 billion different people. X says view counts can include repeat and author views, while its API metric definitions separate post impressions from video-specific view measures.
That is why I do not put “people reached” on a chart whose field is views. I use the platform label.
“The algorithm” is not one public ratio
The official X recommendation explanation describes a personalized For You feed drawing on several sources and signals. The public X algorithm repository is useful context, but it does not let me infer a stable, account-wide rule such as “one reply is worth ten likes” from these observational post counts.
I can observe that a type of post received more views in this sample. I cannot reverse-engineer the exact reason from public snapshots.
The collection method has publication limits
I collected public posts through a commercial search interface, then published aggregate findings. The report does not provide a download of all post text and author data. If you plan your own collection or redistribution, read X’s current terms and developer policy, and use a method and permissions appropriate to your use. I am not presenting this article as permission to scrape or republish other people’s posts.
Questions you may still have
Did I find the best time to post on X?
No. I found descriptive hour-by-day patterns inside a selected AI-post sample. Time zones, audience geography, account size, topic, and news were not held constant. Use your own audience activity and compare similar posts at similar ages before changing your schedule. (Report, pp. 77–79, 94–99)
Are videos and demos guaranteed to get more likes?
No. In the under-25K slice of this sample, video and demonstration-coded posts were both above the stratum median on likes and bookmarks. Those posts were not randomly assigned a format, and the broader demo keyword flag did not reproduce a statistically clear reach advantage. My interpretation is “worth testing if you can show useful proof,” not “guaranteed lift.” (Report, pp. 88, 91–92)
Should I remove every outbound link?
No. Correctly identified off-platform links were associated with lower median likes in this sample, but the study did not measure your site conversions and cannot prove a ranking penalty. If your objective is website traffic, a linked post with qualified visits can beat a linkless post with more likes. Test against that objective. (Report, pp. 85, 128–129)
Why can bookmarks per 100 likes exceed 100?
Because the report takes each post’s bookmark-to-like ratio, multiplies it by 100, then reports the median of those per-post ratios. A post can be bookmarked more often than it is liked. This is not a conversion funnel in which every bookmark must follow a like. (Report, pp. 17, 39)
Does the 20.7K impression result prove the method worked on your account?
No. It shows what my X Analytics displayed for September 9–22 compared with August 26–September 8 while I was applying the ideas. The window was not randomized, the earlier baseline was small, and bookmarks actually fell by one. It is a real before-and-after account snapshot, not a causal estimate.
Can I download the 21,864 posts?
I am sharing the full research report, charts, and aggregate analysis in this article, not a raw corpus of third-party posts. X’s developer policy governs redistribution and should be checked before anyone packages post content or identifiers for another use.
Download the complete report
This article is the readable version of a much larger project. The 135-page What Actually Travels report includes the search design, full tables, visualizations, feature definitions, statistical tests, verification objections, limitations, and appendices.
If you use a figure from it, keep its denominator and caveat next to it. If you quote a post from the corpus, link the original author and check your usage rights. If you turn one of my observations into advice, tell your reader what was observed and what still needs a test.
X-Virality-Research-Report-Promptslove.pdf
2.1 MB
Final thoughts
I began this project asking what “viral” AI posts on X have in common. After 21,864 posts, the most useful answer is not a secret phrase. It is a way of separating the job of a post from the number that happens to be easiest to screenshot.
For a smaller account, I would test short, specific posts when I want reach and detailed, reusable posts when I want saves. I would use a product demonstration when it genuinely shows something a reader could not learn from a claim alone. I would check whether a link is a real outbound link before charting it. And I would keep ordinary posts in the next research sample, because without them, “what successful posts look like” cannot become “what makes a post succeed.”
My own recent account numbers give me a reason to continue: more impressions, engagements, visits, and replies over two weeks. The bookmark decline gives me a reason to keep asking better questions. That is the kind of result I trust enough to build on.