
 Chrome Extension
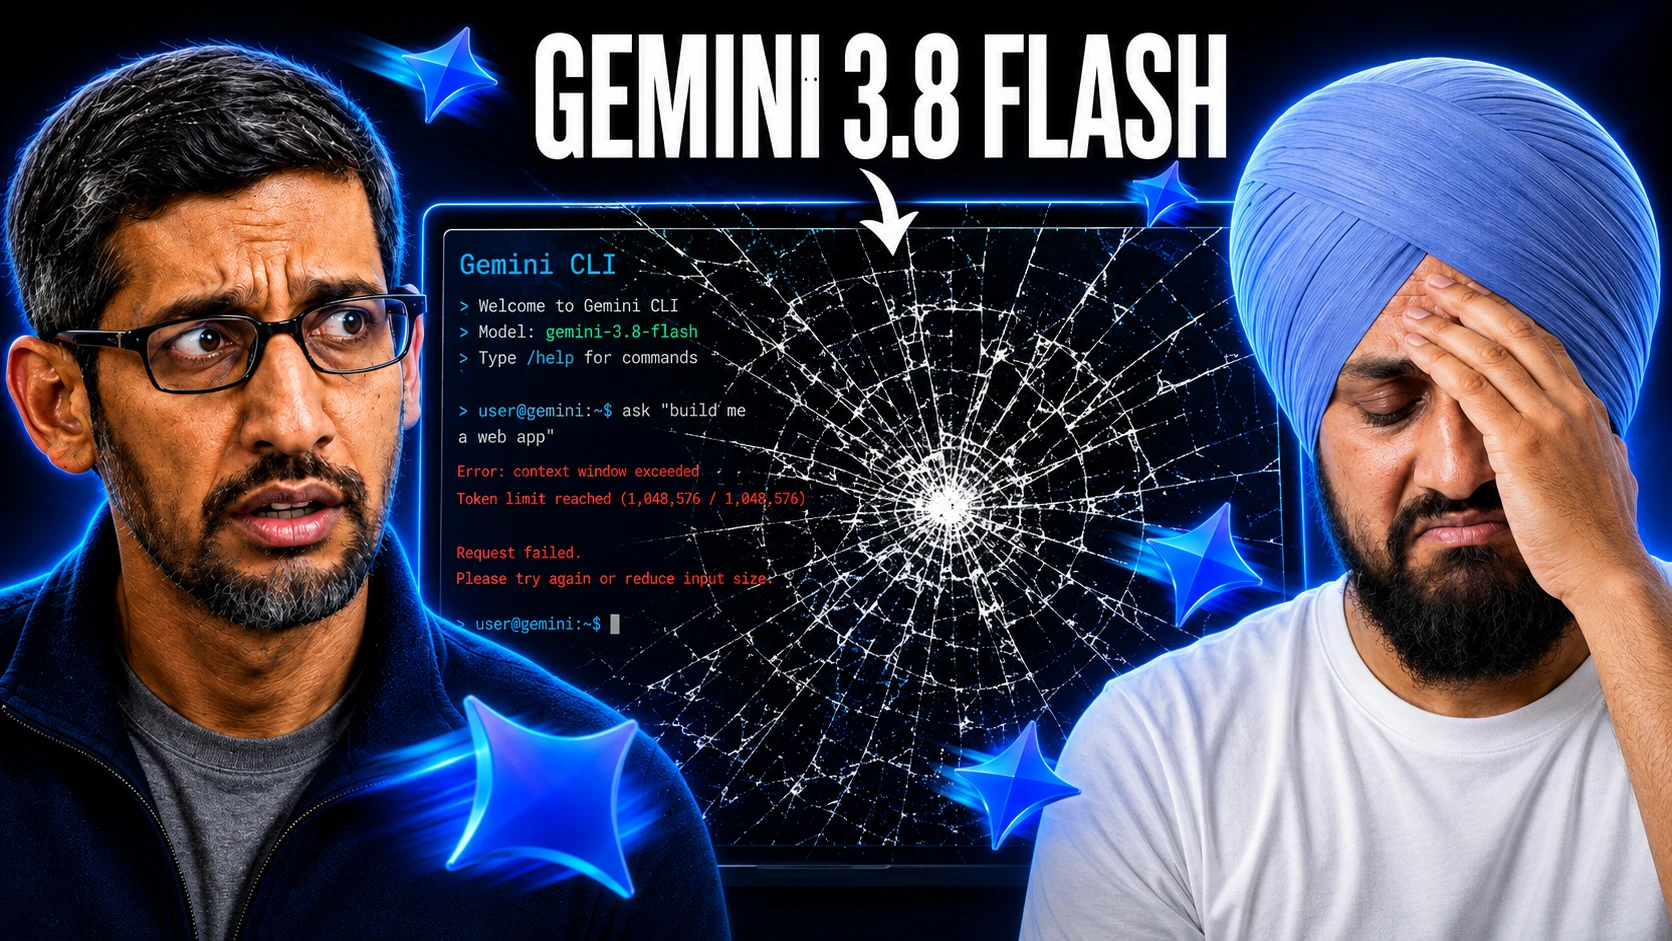
Google says Gemini 3.8 Flash is its most intelligent Flash model yet, and the benchmark charts make it look like it trades blows with Claude Opus 5.
So I built five apps with it, then rebuilt three of those same apps with Opus 5 at the same reasoning level and put them side by side. One of the five is genuinely excellent. Two are broken in ways I could not ignore.
And when I went back to Google's own published numbers afterwards, I found the benchmark that explains exactly what I experienced, sitting right next to the one everybody is quoting. Here is the full comparison, with every claim linked to Google's own documentation.
Key Takeaways
What Gemini 3.8 Flash Actually Is
Let me set the facts before I get to opinions, because the framing around this launch matters.
Google shipped Gemini 3.8 Flash on September 2, 2026, alongside a separate security-focused variant. This is Google's third Flash release in six weeks, which tells you something about the pace right now.
Google's own positioning in the developer docs:
"Gemini 3.8 Flash is our most intelligent Flash model, engineered for long-horizon software engineering, autonomous agents, and complex enterprise workflows, all with the speed and cost efficiency of Flash."
Here is what I verified:
| Spec | Value |
|---|---|
| Model ID | gemini-3.8-flash |
| Released | September 2, 2026 |
| Context window | 1,048,576 tokens (1M) |
| Max output | 65,536 tokens |
| Knowledge cutoff | March 2026 |
| Thinking levels | low, medium, high (default: medium) |
| Input | Text, image, video, audio, PDF |
| Output | Text only |
One detail worth knowing before you test it: minimal thinking is not supported and returns an error. The default is medium, so if you want the results people are posting online, set thinking_level to high explicitly. That is what I used throughout.
The Pricing Is Identical To 3.7 Flash
| Intro (through Dec 31, 2026) | From Jan 1, 2027 | |
|---|---|---|
| Input | $0.75 / 1M | $1.50 / 1M |
| Output | $3.75 / 1M | $7.50 / 1M |
| Cache read | $0.075 / 1M | $0.15 / 1M |
| Batch | 50% discount | 50% discount |
Same price as 3.7 Flash, and that is the real story of this model. You get better numbers for no extra cost. Whether those numbers translate into better output is what I set out to test.
The Cyber Variant Is A Separate Thing Entirely
Google also launched Gemini 3.8 Flash Cyber, which is not available to you or me. It runs through Fairwind, a limited-access program for governments, critical infrastructure operators and trusted partners, with 650+ participating partners.
The numbers there are genuinely interesting: Google's Chrome Security team found it produced 2.6 times more correct patches than the best larger commercial models. Just know that it is a different model behind a gate, and nothing in my review applies to it.
The Benchmark Everyone Quotes, And The One They Skip
This is the part I want to spend real time on, because it explains everything that follows.
The number circulating everywhere is Terminal-bench 2.1, where Gemini 3.8 Flash scores 89.4% against Claude Opus 5's 89.1%. A sub-dollar Flash model edging out a frontier model. That is a great headline.
Now look at the row directly beneath it in Google's own published table:
| Benchmark | Gemini 3.8 Flash | Claude Opus 5 |
|---|---|---|
| Terminal-bench 2.1 | 89.4% | 89.1% |
| Terminal-bench 4.0 | 19.1% | 51.8% |
| DeepSWE v1.1 | 73.7% | 74.0% |
| OSWorld-2.0 | 59.0% | 75.4% |
| GDPVal-AA v2 (Elo) | 1545 | 1824 |
Terminal-bench 2.1 is saturated. Every serious model clusters between 85% and 89%, so a 0.3 point lead is noise. Terminal-bench 4.0 is the harder successor, and there Opus 5 scores 2.7 times higher.
There is a methodology detail that makes the 2.1 comparison weaker still. In Google's own evaluation methodology, Gemini's Terminal-bench 2.1 scores are self-computed, while competitor scores come from the public leaderboard and Artificial Analysis. That is a mixed-source comparison, not a controlled head-to-head.
To be fair to Google, they never claimed parity. Their announcement says 3.8 Flash delivers gains "often approaching the performance of higher-cost frontier models." That is careful, accurate language. The overclaiming happened downstream, in the coverage.
I want to flag one more thing, because I got it wrong in my video and I would rather correct myself than let it stand. I said Terminal-bench 2.1 was 89.14% against Opus 4.5. The actual figure is 89.4%, and the comparison model in Google's table is Opus 5. Opus 4.5 does not appear in Google's materials at all.
How I Tested
I built five apps in OpenCode using Gemini 3.8 Flash at high thinking level. Then I rebuilt three of them in Claude Code using Opus 5, also at high reasoning, and compared them side by side.
Before I get to results, one thing that cost me real time.
I hit repeated timeout and uptime errors throughout, which is something I run into with Gemini models generally. I assumed it was me. It is not. Google's model card known limitations states it directly:
"There may also be occasional slowness or timeout issues. At times, the model might use more tokens to maximize performance, especially at higher effort levels."
The docs repeat that 3.8 Flash "can use more tokens on longer running and complex tasks, by design." So if you are running it inside an agent harness at high thinking, budget for retries.
App 1: Figures, A Financial Document SaaS
The idea was a SaaS that turns financial and operational documents into a dashboard plus board-ready narratives. Upload a PDF report, it extracts the underlying numbers and rebuilds them as interactive charts.
Build "Figures" — a SaaS that turns financial and operational documents into live dashboards
and board-ready narratives. Upload a PDF report, a spreadsheet, or a screenshot of a chart;
Figures extracts the underlying numbers, rebuilds them as interactive charts, and writes the
commentary that explains what changed and why it matters.

Include a real LANDING PAGE, full AUTH with SAMPLE LOGINS, and the complete app.

WHY THIS MODEL: Google calls out chart reasoning (3.7 Flash regressed on CharXiv; 3.8 fixes
it), finance benchmarks (Vals Finance Agent V2), and multimodal document understanding as
3.8 Flash strengths. This build tests all three at once — and at $0.75/$3.75 the unit
economics of "analyze every page of every document" actually work.

STACK: Node 18+, Express 4.x, EJS, PostgreSQL 16 (pg), bcryptjs, express-session,
  connect-pg-simple, multer (uploads), pdf-lib or pdfjs-dist (PDF page → image rendering),
  xlsx (spreadsheet parsing), Lucide icons, vanilla CSS, date-fns.
  Charts: render with SVG/Canvas written yourself — no chart library. This is deliberate;
  it tests whether the model can build a real charting layer.
AI: OpenRouter, base https://openrouter.ai/api/v1, model google/gemini-3.8-flash,
  Bearer {OPENROUTER_API_KEY}. Multimodal: send rendered PDF pages / uploaded images as
  image blocks alongside the instruction. Effort MEDIUM for extraction (accuracy matters),
  LOW for narrative rewrites. Validate all JSON server-side — never trust the shape.

SCOPE NOTE: Figures reports on the user's OWN numbers — it extracts, charts, and summarizes
what the documents say. It does not give investment advice or make forecasts presented as
fact. Any forward-looking language in generated narratives must be clearly framed as the
user's own projection from their own data, and the UI should label AI-generated commentary
as such with a one-click "view source page" link back to where each number came from.

SCHEMA:
  users (id, email, password, name, company, role, plan[free|pro|team], created_at)
  workspaces (id, user_id, name, fiscal_year_start, currency, created_at)
  documents (id, workspace_id, filename, file_type[pdf|xlsx|csv|image], page_count,
    storage_path, status[uploading|extracting|ready|failed], uploaded_at, processed_at)
  extractions (id, document_id, page_number, source_type[chart|table|text|kpi],
    raw_json JSONB, confidence, bbox JSONB, extracted_at)
  datasets (id, workspace_id, name, source_extraction_id, columns JSONB, rows JSONB,
    period_type[monthly|quarterly|annual], created_at)
  charts (id, workspace_id, dataset_id, title, chart_type[line|bar|stacked|area|combo|pie],
    config JSONB, position INT)
  dashboards (id, workspace_id, name, chart_ids JSONB, layout JSONB, is_shared,
    share_token UNIQUE, created_at)
  narratives (id, dashboard_id, period_label, ai_headline, ai_summary, ai_highlights JSONB,
    ai_risks JSONB, generated_at)

SAMPLE LOGINS (seed; password for all: figures2026) — ONE-CLICK tiles AND listed visibly on
the login page:
  demo@figures.app   / figures2026  — "Demo Co" (pro), full workspace with 3 dashboards
  sarah@figures.app  / figures2026  — "Sarah Chen" (team), ops metrics workspace
  free@figures.app   / figures2026  — "Free User", one small dashboard

DEMO DATA (must look alive on first load — this is what sells the demo):
  For demo@: a workspace "Northwind Trading FY26" containing
    - 4 processed documents (a quarterly report PDF, a monthly P&L xlsx, a KPI deck, a
      screenshot of a chart) with realistic extraction records
    - 6 datasets: quarterly revenue by segment, monthly gross margin, headcount by
      department, customer acquisition cost trend, churn by cohort, cash runway
    - 10 charts across types (line, stacked bar, combo with a secondary axis, area)
    - 3 dashboards: "Board Pack Q2", "Monthly Ops Review", "Unit Economics" — each with a
      generated narrative (headline, summary, highlights, risks)
    - Realistic numbers with a real story in them: revenue growing but margin compressing,
      CAC rising, one segment declining. The narratives should reference that story.
  Smaller seeded sets for sarah@ and free@.

LANDING PAGE (/) — a real marketing page:
  Nav; hero ("Your numbers are trapped in PDFs. Get them out." + CTA + an animated mockup
  showing a chart image resolving into a live interactive chart); how it works (upload →
  extract → dashboard + narrative); features grid (chart extraction, table extraction,
  multi-format, auto-narrative, shareable dashboards, source traceability); a sample
  before/after strip (static PDF page → live dashboard); pricing (Free / Pro $29 /
  Team $79, monthly-annual toggle); testimonials; FAQ accordion; footer. Animated on
  scroll, responsive, polished.

THE APP:
  UPLOAD & EXTRACTION (the core pipeline):
    - Drag-drop a PDF, XLSX, CSV, or image. Show a processing view with per-page progress.
    - PDFs: render each page to an image (pdfjs), send pages to Gemini 3.8 Flash as image
      blocks, and ask it to identify every chart, table, and KPI on the page.
    - Spreadsheets: parse locally with xlsx first, then send the parsed structure to the
      model to identify which ranges are actually meaningful datasets vs formatting noise.
    - Images (a screenshotted chart): straight to the model.
    - For each detected CHART, extract the underlying series data — this is the hard part and
      the reason for this build. Request strict JSON:
        { "source_type": "chart", "chart_type": "line|bar|stacked|pie|combo",
          "title": "...", "x_label": "...", "y_label": "...", "unit": "...",
          "series": [ { "name": "...", "points": [ { "x": "Q1 2025", "y": 1.24 }, ... ] } ],
          "confidence": 0.0-1.0,
          "notes": "anything ambiguous — estimated from axis position, unlabeled point, etc." }
    - For TABLES: { "source_type":"table", "columns":[...], "rows":[[...]], "confidence":... }
    - For KPIs: { "source_type":"kpi", "label":"...", "value":..., "unit":"...", "period":"..." }
    - REQUIRE the model to flag low confidence rather than guess, and surface every
      extraction under 0.8 confidence in a "Review extractions" queue where the user can
      correct values inline before they become datasets. Traceability matters more than
      magic here.

  DATASETS: a table view of every extracted dataset, editable inline, with a link back to the
    exact source document + page + bounding box that produced it.

  CHART BUILDER: pick a dataset, pick a chart type, configure axes/series/colors/labels, and
    render it. Charts are drawn in SVG by your own code — line, bar, stacked bar, area,
    combo (bars + line on a secondary axis), and pie. Hover tooltips, animated entry,
    responsive resizing, and accessible (a data table alternative behind a toggle).

  DASHBOARDS: drag-and-drop grid layout of charts + KPI cards. Named, saved, and shareable
    via a public read-only link (/d/:share_token) that renders without auth.

  AI NARRATIVE (the second AI feature):
    "Generate narrative" on a dashboard sends the underlying datasets (as numbers, not
    images) and asks for strict JSON:
      { "ai_headline": "...", "ai_summary": "3-5 sentences on what the data shows",
        "ai_highlights": ["...", "..."], "ai_risks": ["...", "..."] }
    Rules baked into the system prompt: reference only figures present in the data; cite the
    specific numbers in the prose; note direction and magnitude of change; never invent
    context that isn't in the data; flag when a trend is based on too few points.
    Render it as a board-ready summary card above the charts, clearly labeled as AI-generated,
    with each cited number linking back to its source chart.

  EXPORT: dashboard → PDF (print stylesheet), datasets → CSV, narrative → Markdown.
  SETTINGS: workspace, fiscal year, currency, OpenRouter API key, model, extraction
    confidence threshold, delete workspace.

DESIGN: light-mode-first, calm and precise — this is a finance tool, it should feel
  trustworthy. A restrained accent. Inter + JetBrains Mono (all numbers in mono, tabular
  figures). Confidence indicators as subtle bars. The dashboard and the extraction-review
  queue are the two screens that must be excellent.

README: what it does, the 3 sample logins in a table, setup (createdb → migrate → seed →
  OPENROUTER_API_KEY → npm run dev), how the extraction pipeline works, and a clear note on
  reviewing extractions before relying on them.

Output all files completely, no truncation. The chart-extraction pipeline (with confidence
handling and the review queue) and the hand-written SVG charting layer are the critical
pieces.
What worked well:
What did not:
My score: 3 out of 5. The data layer is sound and the values read correctly. The user experience is not up to the mark and the navigation is a mess.
App 2: Plotline, A macOS Screen-To-Data App
This is the one that impressed me, and I want to be clear about it because the rest of this review is critical.
Build "Plotline" — a macOS app that turns any chart, table, or block of text on your screen
into structured data. Hit a global hotkey, drag a region, and Plotline extracts what's in it:
a chart becomes a data table you can re-plot and export, a table becomes CSV, code becomes
copyable text. Everything lands in a searchable visual library.

WHY THIS MODEL: chart reasoning is a called-out Gemini 3.8 Flash strength (3.7 Flash had a
CharXiv regression), and at $0.75/$3.75 you can afford to run it on every screenshot. This is
the most directly useful app in the pack — anyone who reads research papers, dashboards, or
slide decks needs the numbers behind a chart at some point.

STACK: Electron 31, better-sqlite3 (library + FTS5), electron-store (settings),
  Lucide icons (CDN), vanilla JS/HTML/CSS. Use Electron's desktopCapturer + a transparent
  full-screen overlay window for region selection (or screencap via the system where
  simpler). Charts rendered with your own SVG code — no chart library.
AI: OpenRouter, base https://openrouter.ai/api/v1, model google/gemini-3.8-flash,
  Bearer {OPENROUTER_API_KEY}. Send the captured region as a base64 image block.
  Effort: MEDIUM for extraction (accuracy over speed). Validate every JSON response.

WINDOWS:
  Capture overlay: transparent, full-screen, always-on-top — dims the screen and lets the
    user drag a selection rectangle with live dimensions readout. Esc cancels.
  Main window: 1100×760, frameless, vibrancy, custom title bar — the library + result view.
  Settings window.
  Tray: menu-bar icon with quick capture, recent items, and quit.

GLOBAL HOTKEY: Cmd+Shift+2 (customizable) triggers the capture overlay from anywhere.

═══════════ THE EXTRACTION PIPELINE (the core) ═══════════
On capture, send the image to Gemini 3.8 Flash with a classification-then-extraction prompt.
First it identifies WHAT the region contains, then extracts accordingly. Strict JSON:

  { "content_type": "chart|table|text|code|equation|mixed|unknown",
    "confidence": 0.0-1.0,
    "chart": {                          // when content_type is chart
      "chart_type": "line|bar|stacked_bar|scatter|pie|area|combo",
      "title": "...", "x_label": "...", "y_label": "...", "unit": "...",
      "series": [ { "name": "...", "color_hint": "#hex",
                    "points": [ { "x": "...", "y": 12.4 }, ... ] } ],
      "axis_notes": "linear|log, any axis quirks",
      "estimated_values": [ "indices of points read off position rather than a printed label" ]
    },
    "table": { "columns": [...], "rows": [[...]], "has_header": true },
    "text": { "content": "...", "language": "..." },   // also used for code
    "notes": "anything ambiguous or unreadable" }

  CRITICAL ACCURACY RULES to put in the system prompt:
    - If a data point has a printed value label, use it exactly. Only estimate from pixel
      position when there is no label, and list those point indices in "estimated_values".
    - Read the axis scale carefully, including log axes and non-zero baselines.
    - Never invent series or points that aren't visible.
    - If the image is too low-resolution or ambiguous, return low confidence and say why in
      "notes" rather than guessing.

  The UI must surface estimated vs printed values differently — printed values shown plain,
  estimated ones marked with a small indicator and a tooltip. That honesty is the product.

═══════════ THE RESULT VIEW ═══════════
  Split: the captured image on the left (zoomable, with the original always preserved), the
  extracted result on the right.
  - CHART result: an editable data table (fix any value inline) PLUS a live re-rendered chart
    drawn from the extracted data in your own SVG charting code. Switch chart type, toggle
    series, change colors. Side-by-side comparison with the source image so the user can
    eyeball accuracy immediately.
  - TABLE result: an editable grid.
  - TEXT/CODE result: a syntax-highlighted block with a copy button (detect language).
  - A confidence banner at the top, plus the model's "notes" if any.
  - Actions: Copy as CSV / JSON / Markdown table / Python (pandas DataFrame literal) /
    re-chart PNG export. "Re-extract" to try again if the result is poor.

═══════════ THE LIBRARY ═══════════
  Every capture saved with its thumbnail, content type, extracted data, timestamp, source app
  name (if obtainable), and a user-editable title.
  - Grid or list view, filterable by content type, searchable via FTS5 across titles,
    extracted text, table contents, and chart series names
  - Collections for grouping captures from one paper or dashboard
  - MERGE: select multiple chart captures and combine their series into one dataset/chart —
    genuinely useful when a paper splits related data across figures
  - Bulk export a collection to CSV/JSON/XLSX

═══════════ EXTRA AI FEATURES (all LOW effort, all optional) ═══════════
  - "Explain this chart" — a short plain-English read of what the extracted data shows
  - "Suggest a better chart type" — given the extracted data, recommend a clearer encoding
    and offer to apply it
  - Auto-title each capture from its content

═══════════ SETTINGS ═══════════
  OpenRouter API key (prompted on first use, stored via electron-store, never hardcoded),
  model, extraction effort, global hotkey, capture behavior (open main window after capture
  or stay in tray), default export format, chart theme, library retention, delete-all-data.

═══════════ WITHOUT AN API KEY ═══════════
  Capture, library, manual data entry, the charting layer, and all exports still work fully —
  only automatic extraction is disabled, with a clear prompt to add a key. Ship 3 bundled
  sample captures (a line chart, a table, a code block) with pre-extracted results so the
  whole experience demos with no key.

═══════════ DESIGN ═══════════
  Clean, tool-like, dark by default with a light option. Vibrancy sidebar. A distinct accent.
  Inter + JetBrains Mono (tabular figures for all numbers). Fast, snappy transitions —
  capture → result should feel near-instant once the response returns, with a tasteful
  loading state during extraction. The side-by-side image/chart comparison is the signature
  view; make it genuinely satisfying.

═══════════ STRUCTURE ═══════════
  plotline/
  ├── main.js              # windows, tray, global hotkey, capture overlay, IPC
  ├── preload.js
  ├── capture/
  │   ├── overlay.html     # transparent region-select overlay
  │   └── overlay.js       # drag selection, dimensions readout, crop
  ├── services/
  │   ├── extract.js       # OpenRouter multimodal call + JSON validation + repair
  │   └── analyze.js       # explain-chart, suggest-chart-type, auto-title (low effort)
  ├── db/ (schema.js, queries.js — captures, collections, FTS5)
  ├── renderer/
  │   ├── index.html
  │   ├── styles.css
  │   ├── app.js           # library, result view, editable table, exports
  │   └── charts.js        # the SVG charting layer (line/bar/stacked/scatter/area/pie)
  ├── settings/
  └── package.json

═══════════ VERIFY ═══════════
  □ Global hotkey summons the overlay from any app; drag-select crops correctly at Retina scale
  □ Extraction correctly classifies charts vs tables vs text
  □ Chart series data is accurate against a known source; printed values are exact
  □ Estimated values are marked distinctly from printed ones
  □ The re-rendered chart visually matches the source image
  □ Inline editing updates both the table and the chart
  □ All export formats produce valid output (CSV, JSON, Markdown, pandas literal)
  □ FTS search finds captures by their extracted content
  □ Merge combines multiple chart captures correctly
  □ Fully usable with no API key (3 bundled samples work)

Output all files completely, no truncation. services/extract.js (the multimodal prompt +
validation) and renderer/charts.js (the SVG charting layer) are the critical files. The
side-by-side accuracy comparison is what makes this app trustworthy — build it properly.
The app turns any chart, table or block of text on your screen into structured data. It shipped from one prompt with:
Then I tested it on genuinely messy data. It captured the screenshot, extracted with Gemini 3.8 Flash, correctly identified the content as mixed data, and parsed it perfectly.
My score: 5 out of 5. One prompt, no fixes needed.
That result is not an accident, by the way. Extraction and structured output are exactly what a fast multimodal model should be excellent at. This is the model playing to its strengths.
App 3 Head-To-Head: The Platform UI
Now the comparisons. Same prompt, same reasoning level, Gemini 3.8 Flash on the left, Opus 5 on the right.
Build "Parallax" — the website for an Earth-observation satellite company that sells
high-resolution imagery and change-detection analytics. A complete MULTI-PAGE site: 6
interlinked pages sharing one design system, one nav, and smooth page transitions. This
should look like a serious, well-funded space-data company — technical, precise, and
genuinely beautiful.

STACK — pin this exact setup (modern three.js via importmap):
<script type="importmap">
{ "imports": {
  "three": "https://cdn.jsdelivr.net/npm/three@0.170.0/build/three.module.js",
  "three/addons/": "https://cdn.jsdelivr.net/npm/three@0.170.0/examples/jsm/"
}}
</script>
Plus GSAP 3.12 + ScrollTrigger, Lenis smooth scroll, Lucide icons, Google Fonts.
Use SRGBColorSpace, ACESFilmicToneMapping, BufferGeometry. No deprecated APIs.
ALL imagery generated procedurally on canvas — no external image files.

FILES:
  shared.css  — all tokens, components, patterns, both themes
  shared.js   — Lenis, custom cursor, theme toggle, [data-reveal], magnetic buttons,
                tilt cards, nav behavior, PAGE TRANSITIONS, image-comparison slider component
  index.html · imagery.html · constellation.html · applications.html · platform.html · company.html
  js/home.js · js/imagery.js · js/constellation.js · js/applications.js · js/platform.js · js/company.js

DESIGN DIRECTION — "orbital instrumentation":
  Dark-first (space), with a full light theme for the data-heavy pages. Deep space near-black
  base, Earth blues and atmospheric cyans, one signal accent (propose a warm amber for data
  callouts and active states — it reads as instrumentation against all that blue). Fonts: a
  precise technical sans for display + a clean grotesk body + a mono for coordinates,
  timestamps, and telemetry. Everything aligned to a strict grid; real numbers everywhere;
  generous negative space. It should feel like an instrument, not a brochure.

THE 3D HERO (real Three.js WebGL — the centerpiece):
  A rotating Earth built procedurally: a sphere with a canvas-generated landmass/ocean
  texture (multi-octave noise → continents, with polar ice and a plausible coastline),
  a normal map for terrain relief, a separate slowly-drifting cloud layer, and an
  ATMOSPHERE fresnel glow shell (a custom shader — rim-lit blue falloff). Night side shows
  procedurally scattered city lights as emissive points.
  Orbiting it: a SATELLITE CONSTELLATION — 12-20 small satellites on inclined circular
  orbits, each with a faint traced orbital path line, and a translucent COVERAGE SWATH cone
  projecting down to the surface that sweeps as it passes.
  Mouse parallax gently rotates the view. ON SCROLL: the camera descends toward the surface
  while one satellite passes overhead and its swath sweeps beneath — a real approach shot.
  Dispose on page transition; procedural gradient fallback if WebGL is unavailable.

CUSTOM CURSOR (fresh — must differ from every other cursor style):
  A small circular scan cursor: a thin ring with a slowly rotating dashed outer ring, plus a
  live MONO COORDINATE READOUT trailing it (formatted like "12.4382° N  77.5946° E") whose
  numbers update as the cursor moves. On hover over interactive elements the ring snaps
  tighter and the readout switches to the element's label. Hidden on touch devices.

PAGE 1 — index.html (11 sections):
  1. Hero: the 3D Earth + constellation, headline, subhead, two CTAs, a live "satellites in
     orbit / images captured today" telemetry strip
  2. Trusted-by marquee (agencies, research institutions, insurers, agriculture groups)
  3. What we capture: 3 capability cards (optical, radar, thermal) with animated SVG icons
  4. PINNED SCROLL INTERLUDE (300vh) — "a capture, end to end": as you scroll, a satellite
     crosses the frame, its swath locks onto a region, and the view ZOOMS THROUGH RESOLUTION
     LEVELS — from continent, to region, to city, to a 30cm-per-pixel detail — with the
     resolution figure, timestamp, and coordinates counting up in mono alongside. Each zoom
     level is a procedurally generated canvas image, sharpening as you descend. This is the
     signature moment and the hardest thing on the site.
  5. Before/after change detection: three IMAGE COMPARISON SLIDERS (draggable handle) showing
     procedurally generated pairs — deforestation, urban growth, and flooding — each with a
     caption, date range, and a computed change statistic
  6. Revisit rate + coverage stats band (animated counters in mono)
  7. Applications preview grid (6 industries, hover states, links to applications.html)
  8. Testimonials (draggable carousel, [data-cursor-text="DRAG"])
  9. Data pipeline diagram — an SVG flow (capture → downlink → process → deliver) that draws
     itself on scroll with animated packets moving along the path
  10. FAQ accordion (resolution, revisit, licensing, latency)
  11. Final CTA band + rich footer

PAGE 2 — imagery.html: the imagery catalog. A filterable gallery (by sensor type, resolution,
  region, date) of procedurally generated "captures", each card showing a thumbnail, coords,
  timestamp, resolution, and cloud cover %. Clicking opens a lightbox with a zoomable view and
  metadata panel. A featured before/after story with a large comparison slider. A resolution
  explainer that visually demonstrates 3m vs 1m vs 30cm on the same scene. Licensing tiers. CTA.

PAGE 3 — constellation.html: the satellites. A large interactive orbit visualization (a second,
  simpler 3D scene — or a 2D SVG orbital diagram) where hovering a satellite shows its specs
  card (sensor, altitude, inclination, resolution, launch date, status). A spec comparison
  table across satellite generations. A launch timeline that draws on scroll. Ground-station
  network map. Coverage/revisit calculator: pick a latitude, see the revisit interval. CTA.

PAGE 4 — applications.html: who uses it. An industry selector (Agriculture, Forestry, Urban
  Planning, Disaster Response, Maritime, Insurance) that swaps the content below — each with
  the problem, how imagery solves it, a relevant before/after slider, and outcome metrics.
  Two full customer stories with results. An ROI band. CTA.

PAGE 5 — platform.html: the API and tooling. Code samples in a tabbed viewer (cURL / Python /
  JavaScript) each with a working copy button; endpoint reference cards; a live-looking
  "query builder" that assembles a request as you pick parameters; delivery formats; latency
  SLAs; integrations; a sandbox CTA.

PAGE 6 — company.html: mission and team. Founding story; a timeline whose SVG line draws on
  scroll; leadership cards with hover reveal; engineering culture; launch partners; press;
  open roles; a closing full-bleed Earth shot. Footer.

SHARED SYSTEMS (shared.js):
  - Lenis smooth scroll + a thin scroll-progress bar
  - The scan cursor described above
  - Theme toggle persisted in localStorage, smooth transition, icon swap
  - [data-reveal] entrance system (up/left/right/scale variants, batched with stagger)
  - Magnetic buttons; tilt cards with an inner glow following the cursor
  - A reusable IMAGE COMPARISON SLIDER component (draggable handle, keyboard accessible,
    touch supported) used on three pages
  - PAGE TRANSITION VEIL: intercept internal links → veil in → navigate → veil out on load

REQUIREMENTS: 6 distinct background patterns across sections; active nav link indicated;
  frosted-glass nav after scroll; mobile overlay menu; fully responsive; reduced-motion fully
  respected (3D simplifies, sliders still work); accessible (semantic HTML, visible focus,
  aria labels, aria-hidden on decorative SVG, the comparison slider operable by keyboard);
  60fps; cap pixel ratio at 2. All figures (resolution, revisit, altitude) must be internally
  consistent across pages.

DELIVERY: output shared.css and shared.js complete FIRST, then each page with its JS. No
truncation, no "rest is similar" shortcuts. End with a validation checklist.
Gemini 3.8 Flash:
Opus 5:
I will be fair here. Opus 5 also had some light and dark mismatch and a few components with unreadable text. It was not perfect.
But Opus 5 obviously did it better, and there is no room to debate that one.
App 4 Head-To-Head: Strata, A World Formation Simulator
This was a terrain simulator where you start with raw terrain and shape it with your mouse or add geological features.
Build "Strata" — a world formation simulator. Start with raw procedural terrain and watch
geology, hydrology, climate, and vegetation co-evolve into a believable world over simulated
geological time. Interactive: sculpt, storm, erupt, freeze, and change the climate, then
watch the world respond.

DELIVER: ONE self-contained strata.html. All procedural — no external assets required.
Same three.js importmap setup pinned above (three@0.170.0, modern API only).

═══════════ THE SIMULATION CORE ═══════════
A heightmap grid (512×512 default, 256/1024 selectable) held in typed arrays, with several
coupled layers: ROCK height, SEDIMENT depth, WATER depth, MOISTURE, TEMPERATURE, VEGETATION
density, and a HARDNESS map (varying rock resistance — this is what produces cliffs, mesas,
and differential erosion rather than uniform mush).

  1. HYDRAULIC EROSION — droplet-based (the technique that actually produces realistic
     results). Each simulation step, spawn thousands of droplets at random positions; each
     droplet:
       - reads the interpolated height gradient and accelerates downhill (with inertia, so
         it carries momentum around bends rather than following the steepest path exactly)
       - carries sediment up to a capacity proportional to speed × water × slope
       - ERODES when under capacity (scaled by local hardness) and DEPOSITS when over
       - evaporates gradually, dying after N steps
     Run this on the GPU via fragment shaders if feasible, otherwise thousands of droplets
     per frame on the CPU in typed arrays. It must be fast enough to watch the terrain
     change in real time.
  2. THERMAL EROSION — talus slippage: wherever the slope exceeds a critical angle, move
     material downhill. This produces realistic scree slopes and prevents impossible spikes.
  3. HYDROLOGY — accumulate water flow per cell (drainage area). High-accumulation cells
     become visible RIVERS; local minima fill into LAKES; rivers reaching sea level build
     DELTAS from deposited sediment. River width scales with flow.
  4. CLIMATE — a prevailing wind direction carries moisture inland from the ocean.
     OROGRAPHIC PRECIPITATION: as air rises over terrain it drops rain, so windward slopes
     get soaked and a RAIN SHADOW forms in the lee of mountains — emerging from the physics,
     not painted in. Temperature falls with altitude and with distance from the equator line.
  5. VEGETATION — colonizes cells based on moisture, temperature, slope, and soil (sediment
     depth), spreading to neighbors over time and dying where conditions fail. Biomes
     (desert, grassland, forest, alpine, tundra, wetland) emerge from those variables rather
     than being assigned.
  6. STRATA — track deposition history in layers so a cross-section view can show the
     accumulated geological record.

═══════════ RENDERING ═══════════
  3D terrain mesh updated live from the heightmap (update position + normal attributes in
  place; never rebuild the geometry each frame).
  - Terrain shading blends by slope, altitude, moisture, sediment, and vegetation — snow on
    cold peaks, rock on steep faces, sand in dry lowlands, green where vegetation thrives,
    darker wet soil near rivers. All computed in the shader from the simulation layers, so
    the world's appearance IS the data.
  - Water rendered as a translucent surface with depth-based color, subtle flow animation
    along the drainage direction, and environment reflections
  - Sun with real-time shadows; sky gradient; atmospheric fog; ACES tone mapping
  - Orbit/zoom camera plus a low-altitude "flyover" mode
  - A CROSS-SECTION view: drag a line across the map and see a vertical slice showing rock,
    sediment layers, water table, and vegetation — the geological record made visible

═══════════ INTERACTIVE TOOLS ═══════════
  - RAISE / LOWER terrain (brush with adjustable radius and strength)
  - VOLCANO: deposit a cone of new hard rock at a point and watch erosion attack it over time
  - STORM: dump concentrated rainfall over a region and watch flash erosion carve it
  - GLACIER: carve a U-shaped valley along a dragged path (distinct from river V-valleys —
    a genuinely nice geological detail)
  - SEA LEVEL slider: flood or drain the world, revealing continental shelves and creating
    or destroying islands
  - FAULT: raise one side of a dragged line to create a scarp
  - HARDNESS brush: paint resistant rock and watch differential erosion produce mesas

═══════════ TIME & DATA ═══════════
  - Play/pause, speed control (0.25× – 16×), step-one-epoch, and a full reset with seed entry
  - An EPOCH counter with simulated elapsed time ("~240,000 years")
  - LIVE DATA PANEL with charts drawn in your own SVG code (no chart library):
      * elevation histogram, updating as erosion proceeds
      * total sediment moved per epoch (erosion rate over time — it should decay as the
        landscape approaches equilibrium, which is a real geomorphological result)
      * water coverage %, river count, largest lake area
      * biome distribution as a stacked area chart over time
      * a rainfall map heat overlay showing the rain shadow
  - OVERLAY MODES (key to seeing the physics): height · slope · moisture · temperature ·
    water flow accumulation · sediment depth · hardness · vegetation · biome. Each renders
    the terrain in a false-color scheme with a legend.
  - TIMELAPSE: record the heightmap at intervals and scrub back through the world's history

═══════════ 🤖 AI LAYER (OpenRouter) ═══════════
  1. WORLD FROM DESCRIPTION — type a description ("a volcanic archipelago in a monsoon
     climate", "an arid basin ringed by eroded mountains", "a glaciated northern coastline")
     and the model returns a full parameter configuration, applied with an animated
     regeneration. Send the schema WITH valid ranges; request strict JSON:
       { "world_name": "...", "seed": N,
         "initial_terrain": { "octaves": 1-8, "amplitude": 0-1, "ridged": true|false,
                              "continent_scale": 0-1 },
         "sea_level": 0-1, "hardness_variance": 0-1,
         "climate": { "rainfall": 0-1, "temperature": -1 to 1, "wind_direction": 0-360,
                      "wind_strength": 0-1 },
         "erosion": { "rate": 0-1, "droplet_count": 1000-100000, "inertia": 0-1,
                      "deposition": 0-1, "thermal_rate": 0-1 },
         "vegetation": { "growth_rate": 0-1, "spread": 0-1 },
         "description": "one line on the world it configured" }
     CLAMP every value to its range before applying — never trust returned numbers blindly.

  2. GEOLOGICAL REPORT (the genuinely interesting one) — at any point, generate a
     scientific narrative of what has actually happened to this world. Send the simulation's
     REAL statistics (elevation distribution, erosion rate over epochs, river count, largest
     drainage basin, biome percentages, rainfall asymmetry between windward and leeward
     slopes, sediment volume moved) and ask for a short field-report-style write-up:
       { "title": "...", "summary": "3-4 sentences on this world's geological history",
         "landforms": ["notable features identified from the data"],
         "climate_note": "...", "biosphere_note": "...",
         "prediction": "what will happen if the simulation continues" }
     Instruct it to reference only the supplied figures and to name the actual numbers in the
     prose. Rendered as a nicely typeset report panel — this turns the sim into something you
     can narrate over.

  OpenRouter config: EFFORT LOW for world generation (structured output, user waiting),
  MEDIUM for the geological report (it's a reasoning + numeric-interpretation task, and
  chart/data reasoning is a called-out 3.8 Flash strength — this is a good test of it).
  KEY HANDLING: prompted in the panel, localStorage, never hardcoded.
  WITHOUT A KEY: ship 10 hand-tuned world presets ("Highland Basin", "Monsoon Coast",
  "Ancient Shield", "Volcanic Chain", "Glacial Fjords"…) plus a randomize button, and a
  template-based report generator that fills in the real statistics. Fully usable with no key.

═══════════ UI ═══════════
  A left tool dock (brushes and events), a right data panel (charts, stats, overlay picker),
  a bottom timeline (epoch scrubber + playback controls), and a top bar (world name, seed,
  AI description box, presets, save/load). Glassmorphism panels over the 3D view, auto-hiding
  when idle so the world is unobstructed. Clean scientific aesthetic — this should look like
  a research tool, which is exactly what makes it feel impressive.
  Export: PNG screenshot, heightmap PNG (16-bit if possible), OBJ mesh export, and the
  geological report as Markdown.

═══════════ PERFORMANCE ═══════════
  Target 60fps rendering with the simulation running. Decouple simulation steps from render
  frames (run N erosion iterations per frame, adjustable). Update terrain attributes in place.
  Prefer GPU shaders for the erosion pass if you can; if CPU, use typed arrays and avoid
  allocation in the hot loop. Quality settings for grid resolution and droplets per step.

═══════════ VERIFY ═══════════
  □ Raw noise terrain visibly transforms into realistic eroded landscape — dendritic river
    valleys, ridgelines, and sediment fans should EMERGE, not be authored
  □ Rivers form along flow accumulation and reach the sea; lakes fill local minima; deltas
    build at river mouths
  □ A rain shadow appears in the lee of mountains without being explicitly painted
  □ Vegetation colonizes by moisture/temperature/slope and biomes emerge from the data
  □ Erosion rate decays over epochs toward equilibrium (check the chart)
  □ Every tool works: volcano cones erode over time, glaciers carve U-valleys distinct from
    river V-valleys, sea level flooding reveals coherent coastlines, hardness painting
    produces mesas
  □ All overlay modes render correctly with legends
  □ Cross-section view shows accumulated strata
  □ Timelapse scrubbing replays the world's history
  □ AI world configs are clamped; the geological report cites the real numbers
  □ Fully usable with no API key
  □ 60fps at 512² with erosion running

Output the complete single HTML file, no truncation. The droplet erosion solver, the flow
accumulation / hydrology pass, and the orographic rainfall model are the three critical
systems — if erosion doesn't produce dendritic drainage patterns, the whole simulation has
failed regardless of how the UI looks.
Gemini 3.8 Flash: It does not look anything like what I asked for. Analytics update while you work, and the tectonic fault feature looks fine. Everything else falls apart:
Here is my real concern with this one: I cannot see any improvement from 3.7 Flash, despite what the benchmark jump suggests.
Opus 5: Overlays, report data, a proper platform feel. Volcano animation with real detail. Storm rendered distinctly in teal so you can tell features apart. Glaciers, faults, and per-feature analytics for each volcano and storm.
The detailing is top-notch, and it produced the platform I actually described. Opus 5 did it way better.
App 5 Head-To-Head: Wayfarer, A 3D RPG
For this one I gave both models more help than usual. I specified the Three.js stack, provided the CDN, and pointed them at a model from ThreeJS.org. I wanted something in the direction of PUBG or Battlefield.
Build "Wayfarer" — a realistic third-person action RPG set in a post-collapse wilderness.
You play a lone survivor exploring an overgrown landscape, fighting rogue machines,
scavenging, leveling up, and taking on quests from the few people left. Real rigged
character models with animation blending, PBR terrain, and atmospheric lighting.

DELIVER: ONE self-contained wayfarer.html (all HTML/CSS/JS embedded). External 3D assets and
HDRIs load from CDNs at runtime with full fallbacks. No build step.

STACK — pin this exact setup:
<script type="importmap">
{ "imports": {
  "three": "https://cdn.jsdelivr.net/npm/three@0.170.0/build/three.module.js",
  "three/addons/": "https://cdn.jsdelivr.net/npm/three@0.170.0/examples/jsm/"
}}
</script>
Addons: GLTFLoader, DRACOLoader, RGBELoader, EffectComposer, RenderPass, UnrealBloomPass,
SSAOPass (or SAOPass), SMAAPass, OutputPass. Modern API only — SRGBColorSpace,
ACESFilmicToneMapping, BufferGeometry, no deprecated calls.

═══════════ ASSET MANIFEST + FALLBACK CHAIN (build this FIRST) ═══════════
One ASSETS object at the top holding every URL, plus USE_LOCAL_ASSETS to swap all paths to
'./assets/'. Every entry needs a fallback. THE GAME MUST BE FULLY PLAYABLE IF EVERY NETWORK
REQUEST FAILS.

  PLAYER CHARACTER (rigged + animated):
    Primary:   https://threejs.org/examples/models/gltf/Soldier.glb
               Ships with Idle / Walk / Run clips — inspect gltf.animations at load, map
               clips by name (case-insensitive, substring match) rather than by index.
    FALLBACK:  a procedural humanoid from primitives (capsule torso, limbs, head) with
               hand-authored bone-free animation — bob, limb swing driven by a walk-cycle
               sine. It should still read as a moving character.

  ENEMIES / NPCs:
    Primary:   https://threejs.org/examples/models/gltf/RobotExpressive/RobotExpressive.glb
               Large clip set (Idle, Walking, Running, Jump, Punch, Death, Wave, ThumbsUp) —
               ideal for rogue machines AND for gesturing NPCs.
    Wildlife:  https://cdn.jsdelivr.net/gh/KhronosGroup/glTF-Sample-Assets@main/Models/Fox/glTF-Binary/Fox.glb
               (Survey / Walk / Run clips)
    FALLBACK:  procedural angular machine shapes with rotating parts and emissive optics.

  HDRI ENVIRONMENT (the biggest single realism lever):
    Primary:   https://threejs.org/examples/textures/equirectangular/venice_sunset_1k.hdr
               https://threejs.org/examples/textures/equirectangular/quarry_01_1k.hdr
    Alternate: Poly Haven CDN — https://dl.polyhaven.org/file/ph-assets/HDRIs/hdr/1k/<slug>_1k.hdr
    FALLBACK:  procedural gradient sky rendered to a render target → PMREMGenerator.
               Reflections and image-based lighting still work.

  TERRAIN TEXTURES (albedo + normal + roughness — grass, dirt, rock):
    Primary:   Poly Haven textures CDN, pattern
               https://dl.polyhaven.org/file/ph-assets/Textures/jpg/1k/<slug>/<slug>_diff_1k.jpg
               (plus _nor_gl_1k.jpg and _rough_1k.jpg)
    FALLBACK:  procedural canvas textures with generated normal maps from the noise field.

  LOADING: a LoadingManager with a real progress bar, an 8s per-asset timeout, a clear
  console warning per fallback, and an "Assets: 6/8 loaded (2 fallbacks)" line on the
  loading screen so failures are obvious rather than mysterious.

═══════════ THE ANIMATION SYSTEM (the technically hardest part) ═══════════
  Build a proper ANIMATION STATE MACHINE on top of THREE.AnimationMixer:
    States: Idle · Walk · Run · Jump · Attack · Hit · Dodge · Death
    - Crossfade between states with per-transition durations (fadeIn/fadeOut ~0.2s), never
      snap-cut between clips
    - Blend Walk↔Run by speed so the transition is continuous, not a hard switch
    - One-shot clips (Attack, Hit, Dodge, Jump) play with clampWhenFinished and return to the
      correct looping state on the mixer's 'finished' event
    - Attack clips drive a damage window: the hit registers only during the middle portion of
      the swing, not on the key press. This is what makes combat feel weighty.
    - If the loaded model lacks a needed clip (there's no Attack in Soldier.glb), SYNTHESIZE
      it — procedurally rotate the relevant bones over time, or fall back to a whole-body
      lunge tween. Detect the available clips at load and adapt; do not assume a clip exists.
    - Foot-sliding fix: scale the walk/run playback rate to the actual ground speed.

═══════════ CHARACTER CONTROLLER & CAMERA ═══════════
  - WASD movement relative to the camera; Shift sprint (drains stamina); Space jump;
    Ctrl/C crouch; Space-while-moving = dodge roll with i-frames and a stamina cost
  - Character turns smoothly toward the movement direction (slerp, not instant)
  - Gravity, ground snapping via raycast to the terrain, slope limits (can't climb cliffs),
    and a capsule collider against world objects
  - THIRD-PERSON CAMERA: orbit behind the character with spring damping, mouse look,
    scroll to zoom, and CAMERA COLLISION — raycast from character to camera and pull the
    camera in when geometry intersects, so it never clips inside a rock or tree
  - Lock-on targeting (Tab / middle-click): camera frames the target, character strafes
    around it, and the target is highlighted with a subtle indicator
  - Optional first-person toggle

═══════════ THE WORLD ═══════════
  A large open terrain (roughly 1000×1000 units) generated from multi-octave noise:
    - Rolling hills, a valley with a river, rocky outcrops, and a plateau
    - Triplanar or slope-blended texturing: grass on flat ground, rock on steep slopes, dirt
      at transitions — blended in the shader by slope and altitude, not painted by hand
    - VEGETATION via InstancedMesh: thousands of grass billboards (with wind sway in the
      vertex shader), trees, bushes, and rocks scattered by a density map that respects slope
      and avoids the river and paths
    - A river with an animated flowing water surface (scrolling normals, transparency,
      depth-based color) and reflections from the environment map
    - RUINS as points of interest: a collapsed settlement, a machine wreck site, a bridge, a
      watchtower — built from modular primitives, each a quest/loot location
    - Distance fog matched to the HDRI, plus atmospheric perspective on far terrain

  DAY/NIGHT CYCLE: sun arcs across the sky driving the directional light and shadows; sky
  and fog color shift; the environment map intensity ramps down at night; machine optics and
  campfire lights glow in the dark. Configurable cycle length. Night is genuinely darker and
  more dangerous (tougher enemy spawns).

  REALISTIC RENDERING — this is what separates it from a stylized build:
    - HDRI → PMREMGenerator → scene.environment for image-based lighting on everything
    - ACESFilmicToneMapping, SRGBColorSpace, exposure tuned per time of day
    - PCFSoftShadowMap with a tight shadow camera frustum that FOLLOWS THE PLAYER
    - Post-processing: SSAO (subtle — contact shadows in grass and around rocks), bloom
      restricted to genuinely emissive things, SMAA, and a slight vignette
    - Character materials: MeshStandardMaterial with proper roughness/metalness; make sure
      loaded model textures get the correct color space

═══════════ COMBAT ═══════════
  - Melee: light attack (fast, low damage) and heavy attack (slow, telegraphed, high damage),
    chaining into a 3-hit combo if timed. Damage applied during the animation's hit window
    via a capsule sweep in front of the character.
  - Ranged: a scavenged energy weapon with limited charge, aimed over the shoulder
  - Blocking/parry with a shield or brace stance; a perfect parry window staggers the enemy
  - Stamina governs sprint, dodge, and heavy attacks — it's the main tactical resource
  - Enemy damage telegraphs: wind-up animation plus a subtle audio cue, so fights are
    readable and dodging feels earned
  - Hit feedback: impact particles, a brief hit-stop freeze on heavy hits, screen shake,
    damage numbers, and a directional damage indicator

  ENEMIES — 4 machine types plus wildlife:
    SCOUT (fast, weak, alerts others) · SENTRY (ranged, holds position, takes cover) ·
    ENFORCER (heavy melee, telegraphed slam, high HP) · SWARM UNIT (small, groups of 4-6)
    WILDLIFE: foxes that flee, and one aggressive predator type
    AI: patrol routes → detection cone + hearing radius → alert (calls nearby allies) →
    chase → attack → retreat when badly damaged. Pathfinding on a navigation grid derived
    from the terrain, avoiding steep slopes and water. They must not clump into a blob.

═══════════ RPG SYSTEMS ═══════════
  - Stats: Might, Agility, Endurance, Focus → derived damage, stamina, health, crit
  - XP and levels; skill points into a small perk tree (3 branches: combat, survival, tech)
  - Inventory with weight limit; equipment slots (weapon, sidearm, armor, 2 trinkets)
  - Loot with rarity tiers and rolled modifiers, dropped by enemies and found in containers
  - Crafting: combine scavenged parts into repairs, medkits, and ammo at a workbench
  - Survival layer (light, not punishing): hunger and fatigue that gently push you to camp
  - Fast travel between discovered ruins; a compass and a world map with discovered POIs
  - Save/load to localStorage: position, stats, inventory, quest state, discovered POIs,
    time of day

═══════════ 🤖 AI NPCs & QUESTS (OpenRouter) ═══════════
  The differentiator versus a scripted RPG: NPCs you can actually talk to.

  1. CONVERSATIONAL NPCs — approach a survivor and open a dialogue box where you TYPE what
     you want to say. The model responds in character. Each NPC has a persistent persona
     (name, role, personality, what they know, what they want, their attitude toward you)
     plus a short memory of prior exchanges in this playthrough.
     System prompt supplies: the NPC's persona, the world state (time of day, player level,
     completed quests, nearby threats), and a hard instruction to stay in character, keep
     replies to 2-4 sentences, never break the fiction, and never invent quests or items —
     only reference things passed in the context.
     Response format: strict JSON so the game can react —
       { "reply": "the spoken line",
         "mood": "friendly|wary|hostile|afraid|grateful",
         "offers_quest": true|false,
         "quest_hint": "one line, or null",
         "gives_item": "item_id or null" }
     Validate `gives_item` against the real item table; ignore anything unrecognized.

  2. DYNAMIC QUESTS — generated from actual world state (which POIs are undiscovered, which
     enemy types are nearby, player level), returning strict JSON:
       { "title": "...", "briefing": "2-3 sentences in the giver's voice",
         "objective": { "type": "kill|collect|reach|escort|clear", "target": "...",
                        "count": N, "location_poi": "..." },
         "reward": { "xp": N, "items": [...] },
         "completion_line": "..." }
     VALIDATE every objective against things that actually exist in the world before
     offering it — a quest to reach a POI that isn't in the world is worse than no quest.

  3. AMBIENT BARKS — batch-generate short contextual lines (entering a ruin, low health,
     night falling, first sighting of an enemy type) and cache them.

  OpenRouter config: EFFORT LOW for all three — these happen during play and 3.8 Flash
  "works harder" by default, which would stall the game. Stream the NPC reply so text
  appears progressively. Cache aggressively; never call twice for the same situation.
  KEY HANDLING: prompted in settings, stored in localStorage, never hardcoded.
  WITHOUT A KEY: NPCs use a written branching dialogue tree, quests come from a template
  system (objective × target × POI), and barks come from a pool. The game must be complete
  and enjoyable with no API key.

═══════════ UI & AUDIO ═══════════
  Health/stamina bars, XP bar, hotbar, compass strip, quest tracker, damage indicators,
  interaction prompts, inventory/character/map/crafting panels (tabbed), dialogue box with
  typed input, and a death/respawn screen. Clean, diegetic-feeling, not cluttered.
  Audio synthesized with Web Audio: footsteps varying by surface, sword/impact hits, machine
  servo whines, ambient wind, a night ambience layer, UI clicks, level-up sting.

═══════════ PERFORMANCE ═══════════
  60fps target: instance all vegetation; LOD on trees and enemies; frustum culling; cap
  active enemy count and despawn distant ones; only one shadow-casting directional light;
  quality preset (Low/Medium/High/Ultra) controlling post-processing, shadow resolution,
  vegetation density, and draw distance.

═══════════ VERIFY ═══════════
  □ Fully playable with every external asset failing (test that path deliberately)
  □ Animation clips are detected by name at load, not hardcoded by index
  □ Walk↔Run blends continuously; no foot sliding; one-shot clips return to the right state
  □ Attack damage lands during the hit window, not on key press
  □ Camera never clips inside geometry (camera collision works)
  □ Character can't climb cliffs or walk on water; ground snapping is stable on slopes
  □ Enemies patrol, detect, alert allies, chase, attack, and retreat — without clumping
  □ Lock-on works and the character strafes correctly around the target
  □ Day/night visibly changes lighting, and night spawns are tougher
  □ AI NPCs stay in character and never reference items or quests that don't exist
  □ Save/reload restores position, stats, inventory, and quest state
  □ 60fps at High with vegetation and 10+ active enemies

Output the complete single HTML file, no truncation. The animation state machine, the
third-person camera with collision, and the asset fallback chain are the three critical
systems — an RPG with snapping animations or a camera inside a rock is a failed build no
matter how good the lighting is.
Gemini 3.8 Flash: It looks pretty standard, and it did not use Three.js at all despite me explicitly specifying it and handing over the CDN. Then the controls:
Given that I supplied the demo map, the stack and the CDN, this is pretty bad. I was genuinely disappointed.
Opus 5: First-person and third-person views. A map that honestly looks like a real PUBG environment. Enemies that attack. Jumping. A companion character named West with working dialogue. A death mechanic that told me I fell.
It looks like an actual 3D RPG.
What People Are Building With Gemini 3.8 Flash
My experience is one data point, so I went through X to see what everyone else is getting. The picture is more positive than mine, and the pattern in it is informative.
The most impressive build I found is an image-to-SVG conversion of a BMW M4 CS, done in Antigravity at high thinking level with browser tools, taking about 23 minutes:
https://x.com/HarshithLucky3/status/2095437590635979171
What makes that thread worth reading is the follow-up, where he explains the model did not write 45MB of SVG by hand. It wrote preprocessing code for matting, defringing and edge cleanup, isolated the car, then generated the vector:
https://x.com/HarshithLucky3/status/2095478321538859063
On speed, 35 seconds to rebuild a mobile mini game, recorded with no cuts:
https://x.com/genevieve__h/status/2095453343401337279
A one-shot solar system in a single file with zero tools and zero edits:
https://x.com/analogalok/status/2095479489723593007
His line was that he did not expect a sub-dollar Flash model to pull it off, which I think is the right frame for this model.
And the DeepSWE gap framed the way most people are sharing it:
https://x.com/sandeep_alluru/status/2095487581324496959
Notice what the successful builds have in common. Single-file generation, image-to-vector conversion, fast focused rebuilds. Those are contained, well-specified tasks. My failures were all long-horizon builds with many interacting parts, which is precisely the shape of problem Terminal-bench 4.0 measures.
Worth noting: Google's own DevRel is actively asking for critical feedback on launch week, which I think is a good sign.
https://x.com/patloeber/status/2095485246607106444
My Honest Verdict
Gemini 3.8 Flash is nowhere near Opus 5 for the kind of work I do, and it is not close enough for the comparison to be interesting on complex builds.
But I want to be precise, because "it lost to Opus 5" is a lazy conclusion when the two models cost wildly different amounts.
Where Gemini 3.8 Flash genuinely delivers:
Where it fell down for me:
The honest framing is this. Google built a workhorse and priced it like one. The benchmark chart made people read it as a frontier model, and it is not. On Google's own hardest published coding benchmark, it scores 19.1% where Opus 5 scores 51.8%, and my five apps landed exactly where that number predicted.
If you are choosing today: use Gemini 3.8 Flash for extraction, parsing, high-volume structured work and quick single-file builds. Use Opus 5 when the thing you are building has to actually hold together.
Frequently Asked Questions (FAQs)
Is Gemini 3.8 Flash as good as Claude Opus 5?
No, and Google does not claim it is. Google's wording is that it is "often approaching the performance of higher-cost frontier models." On Google's own Terminal-bench 4.0 results, Opus 5 scores 51.8% against 3.8 Flash's 19.1%. On the saturated Terminal-bench 2.1, they are within 0.3 points.
How much does Gemini 3.8 Flash cost?
$0.75 per million input tokens and $3.75 per million output tokens through December 31, 2026, then doubling to $1.50 and $7.50. That is identical to Gemini 3.7 Flash pricing.
What thinking levels does Gemini 3.8 Flash support?
Three: low, medium and high. Medium is the default, and minimal is explicitly unsupported and will return an error. Set thinking_level to high for complex work.
Why do I keep getting timeout errors with Gemini 3.8 Flash?
This is a known limitation Google documents in the model card, which mentions occasional slowness and timeout issues, plus higher token use at higher effort levels. If you are running it in an agent harness, plan for retries and exponential backoff.
What is Gemini 3.8 Flash Cyber?
A separate security-focused variant for autonomous vulnerability detection and automated patching. It is not publicly available, and runs through Google's Fairwind program for governments, critical infrastructure operators and trusted partners.
Is Gemini 3.8 Flash good for building complete apps?
It depends on the app's complexity. It handled a macOS data-extraction tool perfectly from one prompt, but broke down on a 3D game and a physics simulator, ignoring explicit stack instructions and shipping inverted controls. Use it for contained, well-specified builds.
Final Thoughts
I went into this expecting the benchmark story to hold, and it did not. That is not Google lying, it is a saturated benchmark being quoted without the harder one beside it.
If you are testing 3.8 Flash this week, do two things. Set thinking_level to high, because medium is the default and it is not what the demos use. And match the model to the task shape rather than the benchmark, since extraction and single-file work is where it genuinely competes.
For everything I use to build and prompt these models, head over to promptslove.com.