
 Chrome Extension
You have probably seen the claim that ChatGPT drinks a 500ml bottle of water every time you ask it a question. I went looking for the study behind that number, and what I found is that the study says something quite different.
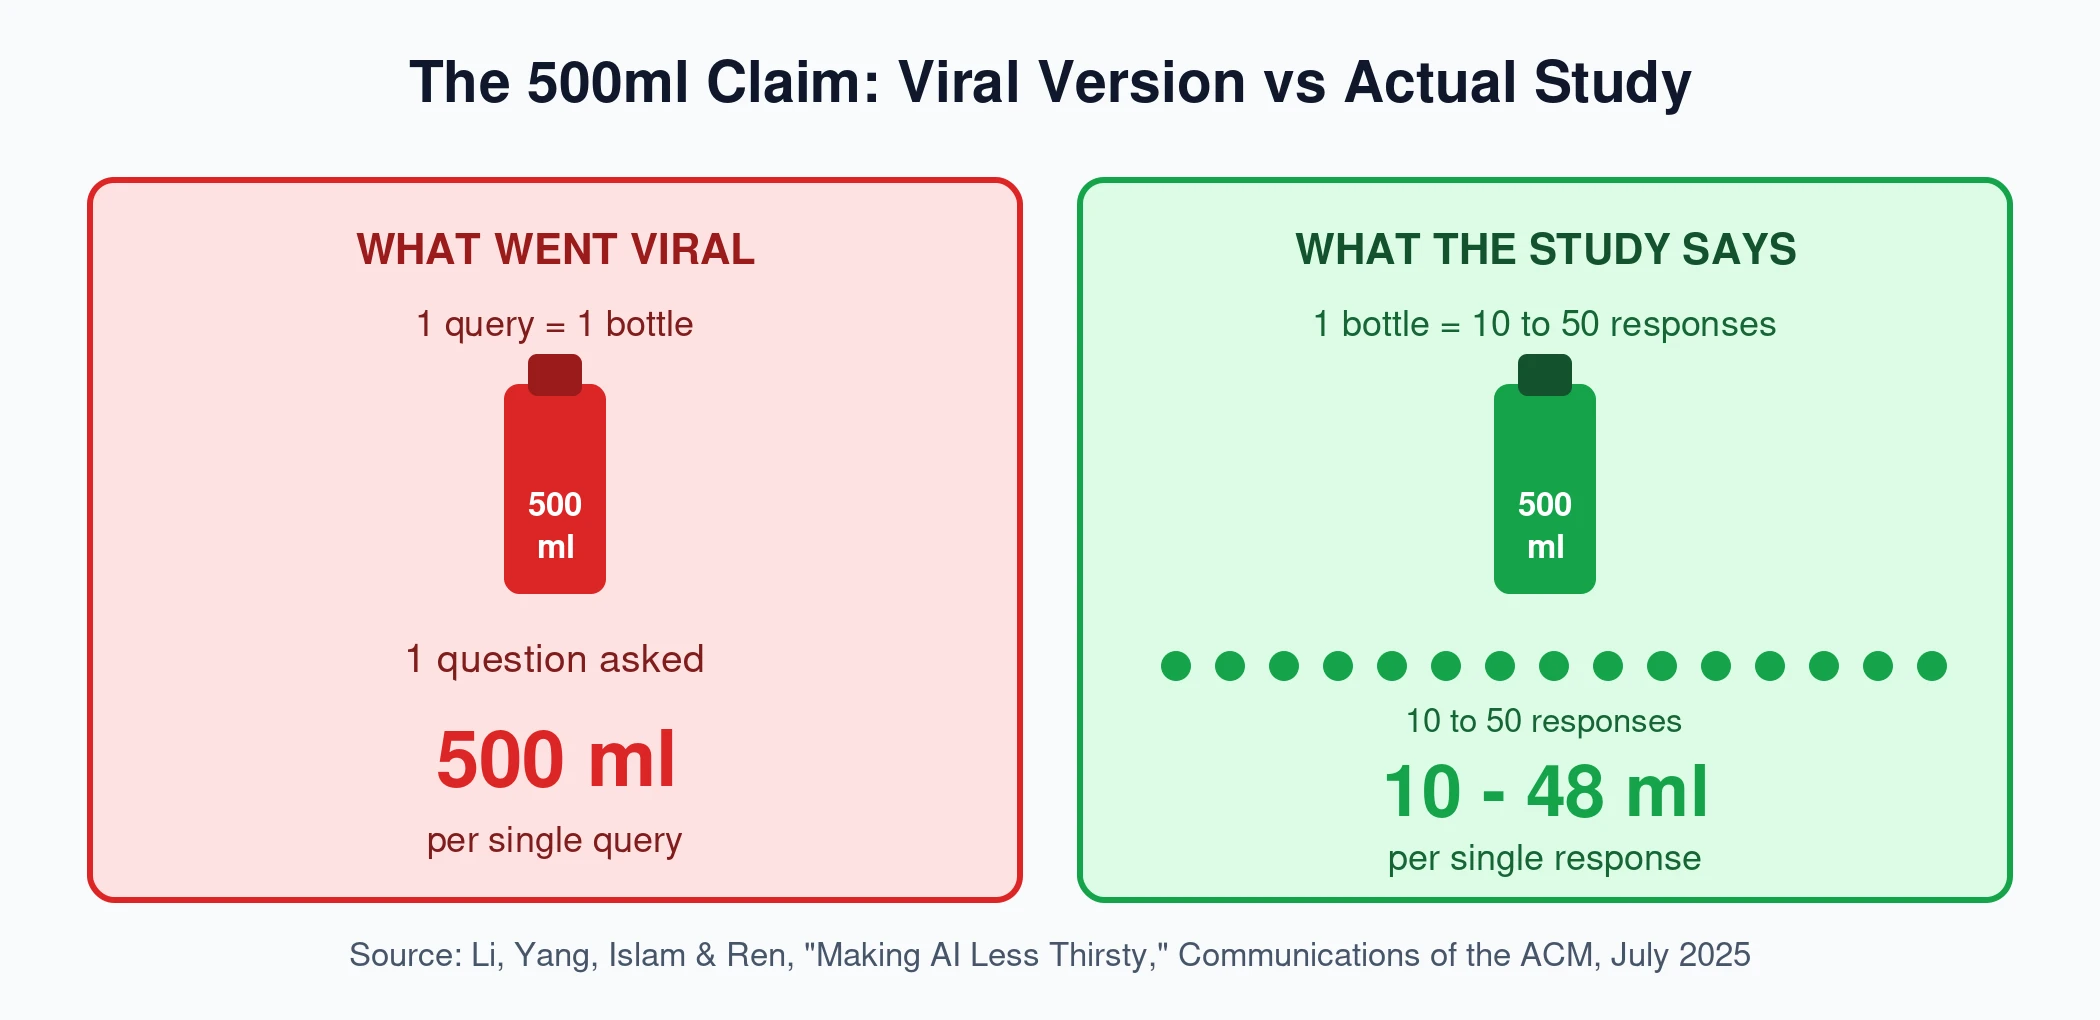
The real figure is 500ml per 10 to 50 responses, which makes the popular version wrong by a factor of 10 to 50.
In this guide I walk you through what the peer-reviewed research actually says about how much water AI uses, why credible estimates range from 0.26ml to roughly 48ml per query, what the four biggest tech companies report in their own filings, and where the genuine problems are.
Every figure below is linked to its primary source.
Key Takeaways
The 500ml Myth, And What The Study Actually Says
Let me start with the number you have almost certainly seen, because getting this right changes how you read everything else.
In April 2023, a research team from UC Riverside and UT Arlington published a preprint called "Making AI Less Thirsty." Headlines followed within days. Business Insider and Euronews both ran versions of "ChatGPT drinks a bottle of water for every 20 to 50 questions."
Here is what the paper, now peer-reviewed and published in Communications of the ACM in July 2025, actually says:
GPT-3 "needs to 'drink' a 500ml bottle of water for roughly 10-50 medium-length responses."
Read that again. 500ml per 10 to 50 responses. That works out to roughly 10ml to 48ml per response, not 500ml.
Somewhere between the paper and your feed, "per 10-50 responses" became "per query." I have seen the 500ml figure repeated in news articles, LinkedIn posts, and policy discussions as though it applies to a single question. It does not.
Three more things about that study matter, and almost nobody mentions them:
So How Much Water Does AI Actually Use Per Query?
The honest answer is that there is no single correct number, and anyone who gives you one without a range is skipping the interesting part.
Here are the three figures currently in circulation, and I want you to notice how differently they were produced:
| Source | Per-query water | What it counts | Peer-reviewed? |
|---|---|---|---|
| Ren et al., CACM 2025 | 16.9 ml (US average) | On-site + off-site power water | Yes |
| Google, Aug 2025 | 0.26 ml (median Gemini prompt) | On-site cooling only | No |
| Sam Altman, June 2025 | 0.32 ml | Undisclosed | No, and no methodology |
That is a 65x gap between the top and bottom, and it is not because someone made an arithmetic error. It is because they are measuring different things.
Google's Number: Five Drops Per Prompt
In August 2025, Google published a technical report titled "Measuring the environmental impact of delivering AI at Google Scale." The author list includes Jeff Dean and David Patterson, which is not a small signal.
Their headline finding for a median Gemini Apps text prompt: 0.24 Wh of energy, 0.03 grams of CO2e, and 0.26ml of water, which they describe as about five drops.
That is a genuinely useful number, and Google deserves credit for publishing methodology at all. But you need to know what it excludes, because Google says so directly in the paper: external network energy, end-user device energy, model training, data storage, and off-site power-generation water.
Shaolei Ren, the UC Riverside researcher behind the original study, told The Verge what he thinks of that:
"They're just hiding the critical information. This really spreads the wrong message to the world."
His specific objection is that Google compares its on-site-only figure against Ren's on-site-plus-off-site figure, which is not a like-for-like comparison. The International Energy Agency puts indirect water at about 60% of total datacenter water consumption, so leaving it out is not a rounding decision.
One detail I found telling: Google's own per-prompt water figure rose from 0.12ml in its 2024 report to 0.26ml in the 2026 one.
OpenAI's Number: One Fifteenth Of A Teaspoon
In June 2025, Sam Altman published a post on his personal blog called "The Gentle Singularity." In it he wrote:
"the average query uses about 0.34 watt-hours... It also uses about 0.000085 gallons of water; roughly one fifteenth of a teaspoon."
0.000085 US gallons is 0.32ml. Worth flagging: DataCenterDynamics reported this as 0.386ml, which is an imperial-gallon conversion error. Altman is American, so US gallons is the right read.
More importantly, there is no methodology behind this number. No scope disclosure, no definition of "average," no training-versus-inference split, and it appeared on a personal blog rather than in any OpenAI publication. I cannot tell you whether it includes power-generation water, which means I cannot meaningfully compare it to either of the other two figures.
Why The Estimates Vary So Wildly
This is the part that most coverage skips, and it is the part that actually helps you evaluate any water claim you come across. Nine factors drive the spread.
Scope 1 vs Scope 2 Water Is The Biggest Factor
Datacenters use water in two completely different places.
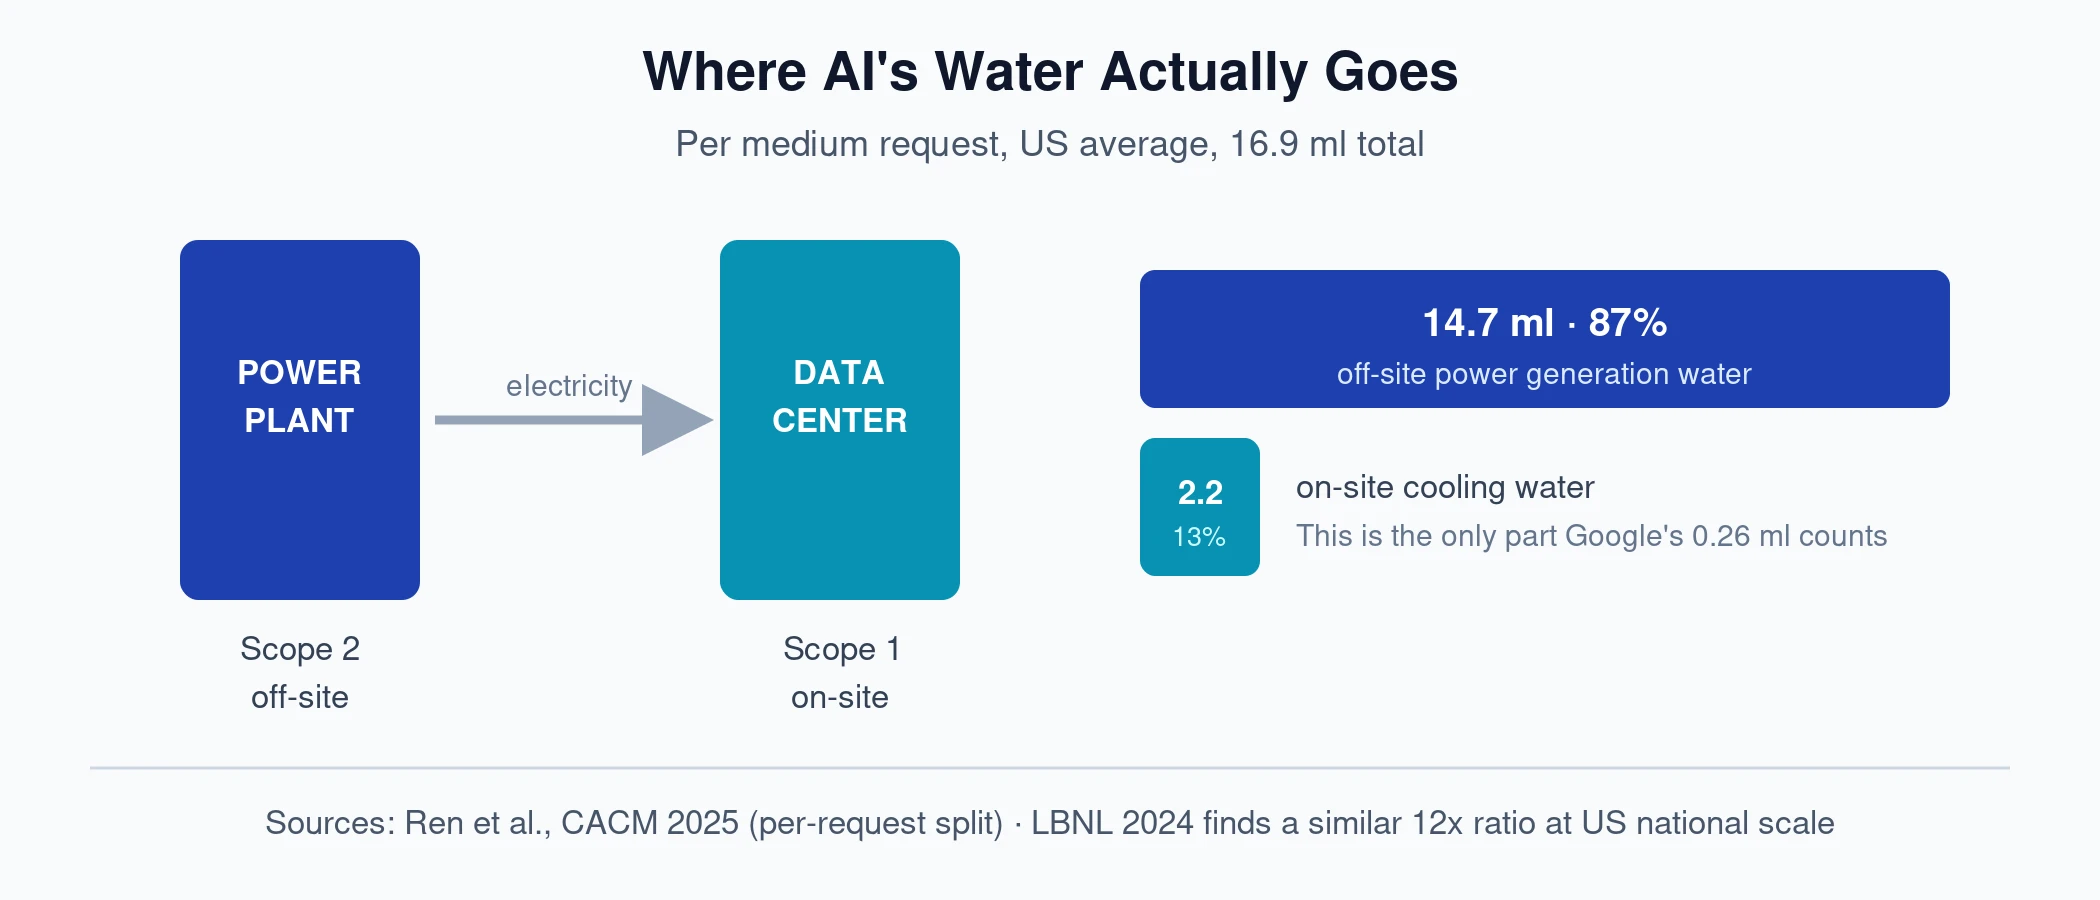
On-site (scope 1) is the water evaporated in cooling towers at the building itself. Off-site (scope 2) is the water evaporated at the power plants generating the electricity that datacenter consumes.
In Ren's US-average breakdown, on-site is 2.2ml per request and off-site is 14.7ml. That means 87% of the total is power-plant water, not datacenter cooling.
Lawrence Berkeley National Laboratory's 2024 report found the same pattern at national scale: US datacenters directly consumed 66 billion litres in 2023, while indirect power-generation water was roughly 800 billion litres. That is about a 12x ratio.
Meta's own disclosure shows an even wider gap. Its 2025 Environmental Data Index reports 5,637 megalitres of direct withdrawal against 72,207 megalitres of embedded water in purchased electricity, roughly 23 times more.
Location Changes The Answer More Than You Think
Ren's paper includes a table of the same request run in different datacenter locations. The spread is dramatic:
| Location | Water per request |
|---|---|
| Ireland | 7.1 ml |
| Texas | 7.6 ml |
| Virginia | 11.4 ml |
| Iowa | 15.0 ml |
| Finland | 20.4 ml |
| Arizona | 29.9 ml |
| Washington | 47.5 ml |
That is a 6.7x spread from geography alone, with the same model and the same request.
Two of those entries surprised me. Finland looks like it should be efficient, and its on-site water is indeed remarkably low at 0.04ml per request. But its total is 20.4ml because of grid water intensity, meaning almost all of Finland's footprint comes from electricity generation rather than cooling.
Washington ranks worst not because its datacenters are badly run but because of hydroelectric reservoir evaporation. Water evaporating off dam reservoirs gets counted against the electricity those dams produce.
The Other Seven Factors
Withdrawal vs Consumption: The Distinction That Breaks Most Comparisons
If you take one technical concept from this article, make it this one.
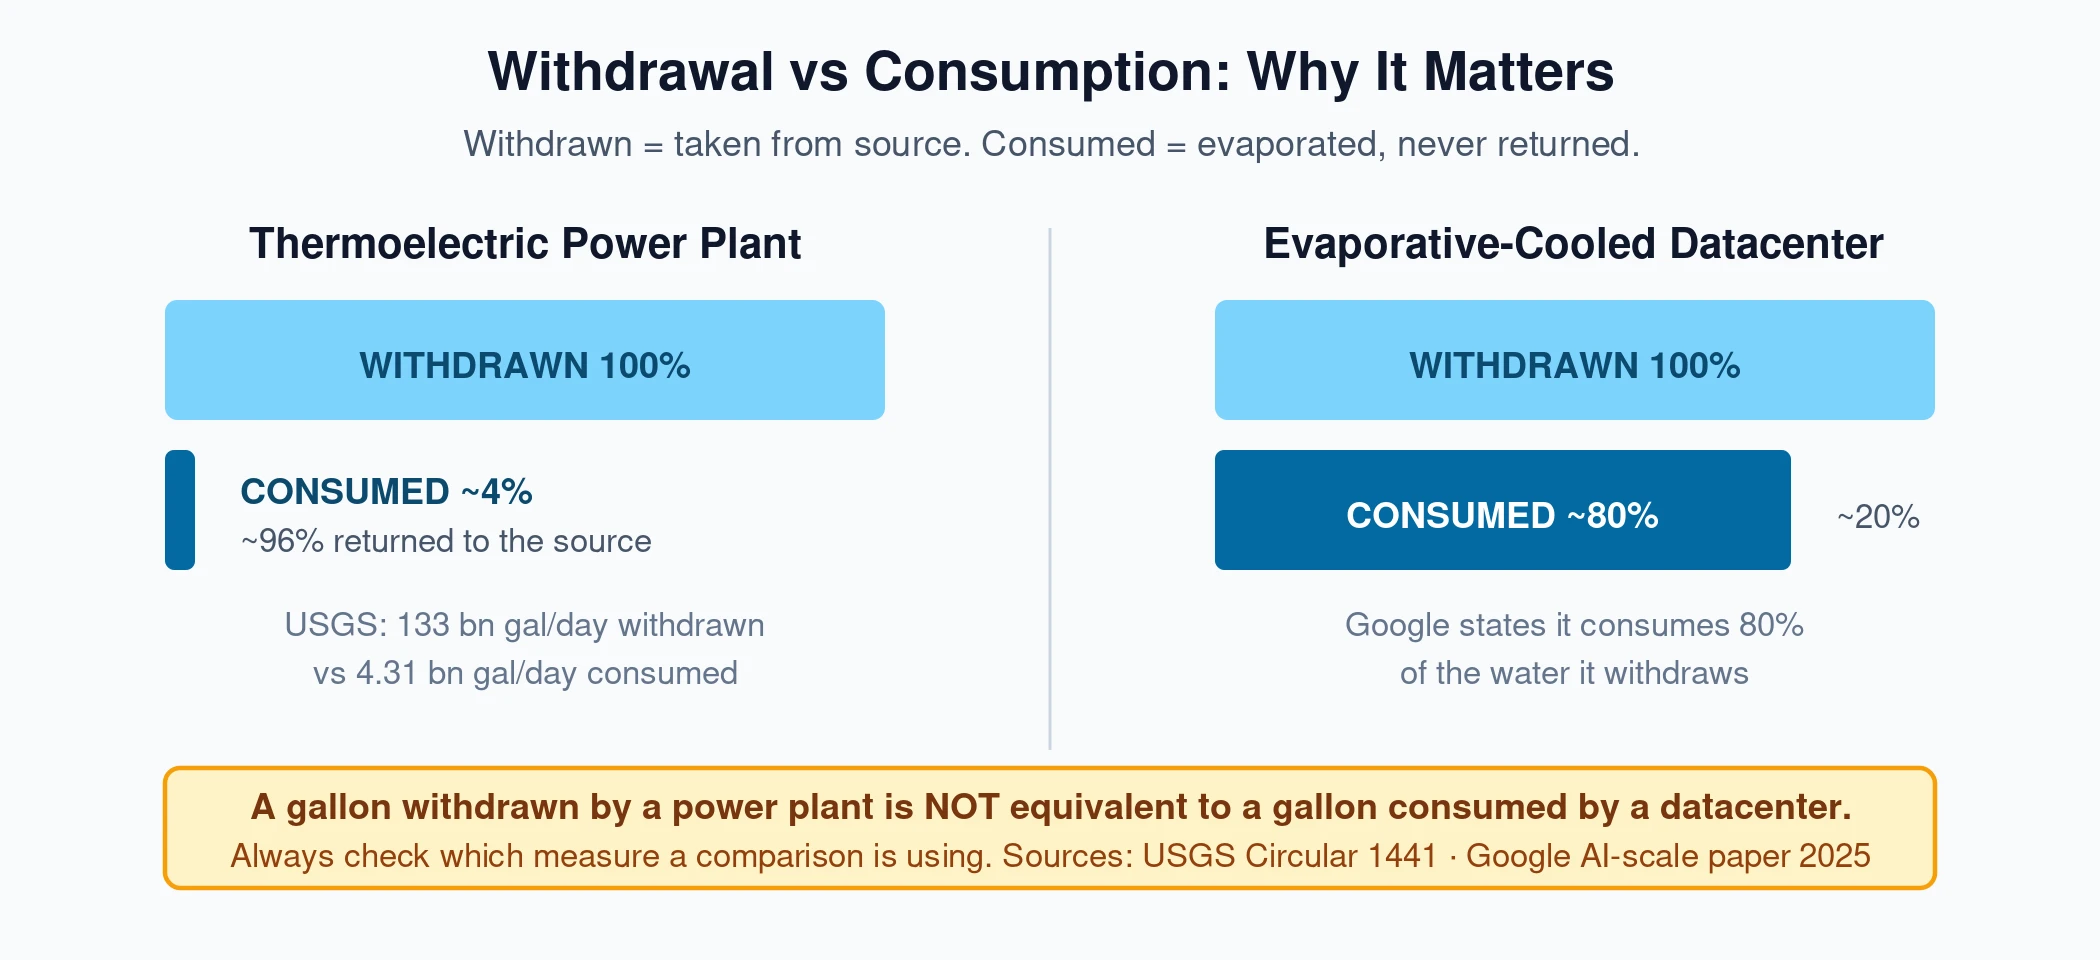
The USGS defines withdrawal as water removed from a source, and consumption as the portion evaporated or incorporated into a product and never returned.
The gap between them can be enormous. US thermoelectric power plants withdrew 133 billion gallons per day in 2015 but consumed only 4.31 billion, according to USGS Circular 1441. That is about 3%. A nuclear plant on once-through cooling withdraws 44,350 gallons per MWh and consumes 269, a 165x difference.
Here is why this matters for AI specifically, and it cuts against the tech industry rather than for it.
Datacenters are the opposite case. Google states it consumes 80% of the water it withdraws. Evaporative-cooled datacenters evaporate roughly four fifths of their intake and return one fifth. Power plants return about 96%.
So when someone compares "datacenters used X gallons" to "agriculture used Y gallons," ask which measure each number is. A gallon withdrawn by a power plant and a gallon consumed by a datacenter are not the same thing.
How Datacenters Actually Use Water
There is a tradeoff at the heart of datacenter cooling that almost never appears in coverage, and once you see it, several confusing claims start making sense.
LBNL states it plainly on page 45 of its 2024 report:
"there are tradeoffs between low PUEs and low site WUEs... water-cooled chillers and other evaporation-based cooling systems are generally more energy efficient than an air-cooled chiller or other waterless systems. While air-cooled chillers use no water, they use more energy."
In other words, saving water usually costs electricity, and saving electricity usually costs water. A datacenter that uses zero water for cooling typically burns two to three times the electricity of an evaporative equivalent. And since generating electricity itself consumes water, going waterless on-site can mean using more water somewhere else.
That tradeoff was confirmed in Nature Reviews Clean Technology in 2026, which found that cutting water use can actually increase carbon emissions.
Here is how the main cooling approaches compare:
| Cooling method | Water use | Energy use |
|---|---|---|
| Evaporative cooling tower | Highest | Lowest |
| Adiabatic / hybrid | Wet mode only, hot hours | Low to moderate |
| Airside economizer | Minimal | Low in mild climates |
| Air-cooled chiller (dry) | Zero | 2 to 3x higher |
| Closed-loop liquid / immersion | Initial fill only | Efficient |
One correction worth making, because I see this claim a lot: liquid cooling is not automatically waterless. LBNL models liquid-cooled halls running on waterside economizers that "use substantial amounts of water, like all evaporative cooling," and projects US fleet water intensity to rise from about 0.36 to 0.45-0.48 L/kWh by 2028, partly because of liquid-cooled AI hardware.
WUE, The Metric To Watch
Water Usage Effectiveness is annual site water in litres divided by IT equipment energy in kWh. Lower is better. Here is what the major players report:
| Company | Reported WUE (L/kWh) |
|---|---|
| Amazon / AWS | 0.12 (2025) |
| Meta | 0.19 (2024) |
| Microsoft | 0.27 (FY25) |
| LBNL US fleet average | ~0.36 |
| 1.15 (LLM-serving fleet) |
One number to stop repeating: the widely-quoted "industry average of 1.8 to 1.9 L/kWh" traces back to LBNL's 2016 report and has been superseded by the 0.36 figure. AWS's marketing cites a 0.84 industry average that I could not source anywhere.
What The Big Four Actually Report
I went through the most recent sustainability filings from Google, Microsoft, Meta and Amazon. The growth trend is the clearest signal in the entire dataset.
From its 2026 Environmental Report, covering calendar 2025:
| Million gallons | 2020 | 2023 | 2024 | 2025 |
|---|---|---|---|---|
| Withdrawal | 5,689 | 8,653 | 11,011 | 14,689 |
| Consumption | 3,749 | 6,352 | 8,135 | 10,869 |
Consumption grew 33.6% in 2025 alone, and 190% since 2020. That is roughly a 24% compound annual growth rate.
Google's pledge is to replenish 120% of the freshwater it consumes by 2030. It reports 78% progress as of 2025, up from 63% in 2024.
Microsoft
From its 2026 Environmental Data Fact Sheet, FY25 ending June 2025:
| Megalitres | FY20 | FY23 | FY24 | FY25 |
|---|---|---|---|---|
| Withdrawal | 6,794 | 9,666 | 11,590 | 13,266 |
| Consumption | 3,990 | 5,818 | 6,693 | 8,170 |
Consumption up 105% since FY20. Microsoft also notes roughly half of this occurs in water-stressed areas.
Worth knowing if you are comparing against older reporting: Microsoft retroactively restated every prior year in this document. FY23 consumption moved from 7,844 to 5,818 megalitres, a 26% revision downward.
Microsoft has also announced a closed-loop datacenter design that "consumes zero water for cooling," avoiding over 125 million litres per year per facility. Pilots run in 2026, with facilities online late 2027, so none of this appears in current figures yet.
Meta and Amazon
Meta's 2025 Environmental Data Index shows the slowest growth of the four: withdrawal up 6.9% and consumption up just 1.5% in 2024, while its electricity use rose 20.2%.
Amazon published its first-ever absolute water volume in June 2026: "In 2025, we withdrew about 2.5 billion gallons across our entire global data center footprint," roughly 9.4 billion litres. There is no consumption figure and no prior-year absolute number to compare against.
What None Of Them Tell You
This is the gap that matters most for the question in this article's title:
On replenishment pledges specifically, WWF's "Net Positive Water" brief is worth reading. It argues offsetting must happen in the "same basin, same place and same time," warns against "chasing drops," and notes a company "can meet its commitments but still face the same water challenges." WWF explicitly does not endorse the phrase "net positive water."
The Scale Question: Is This Actually A Lot?
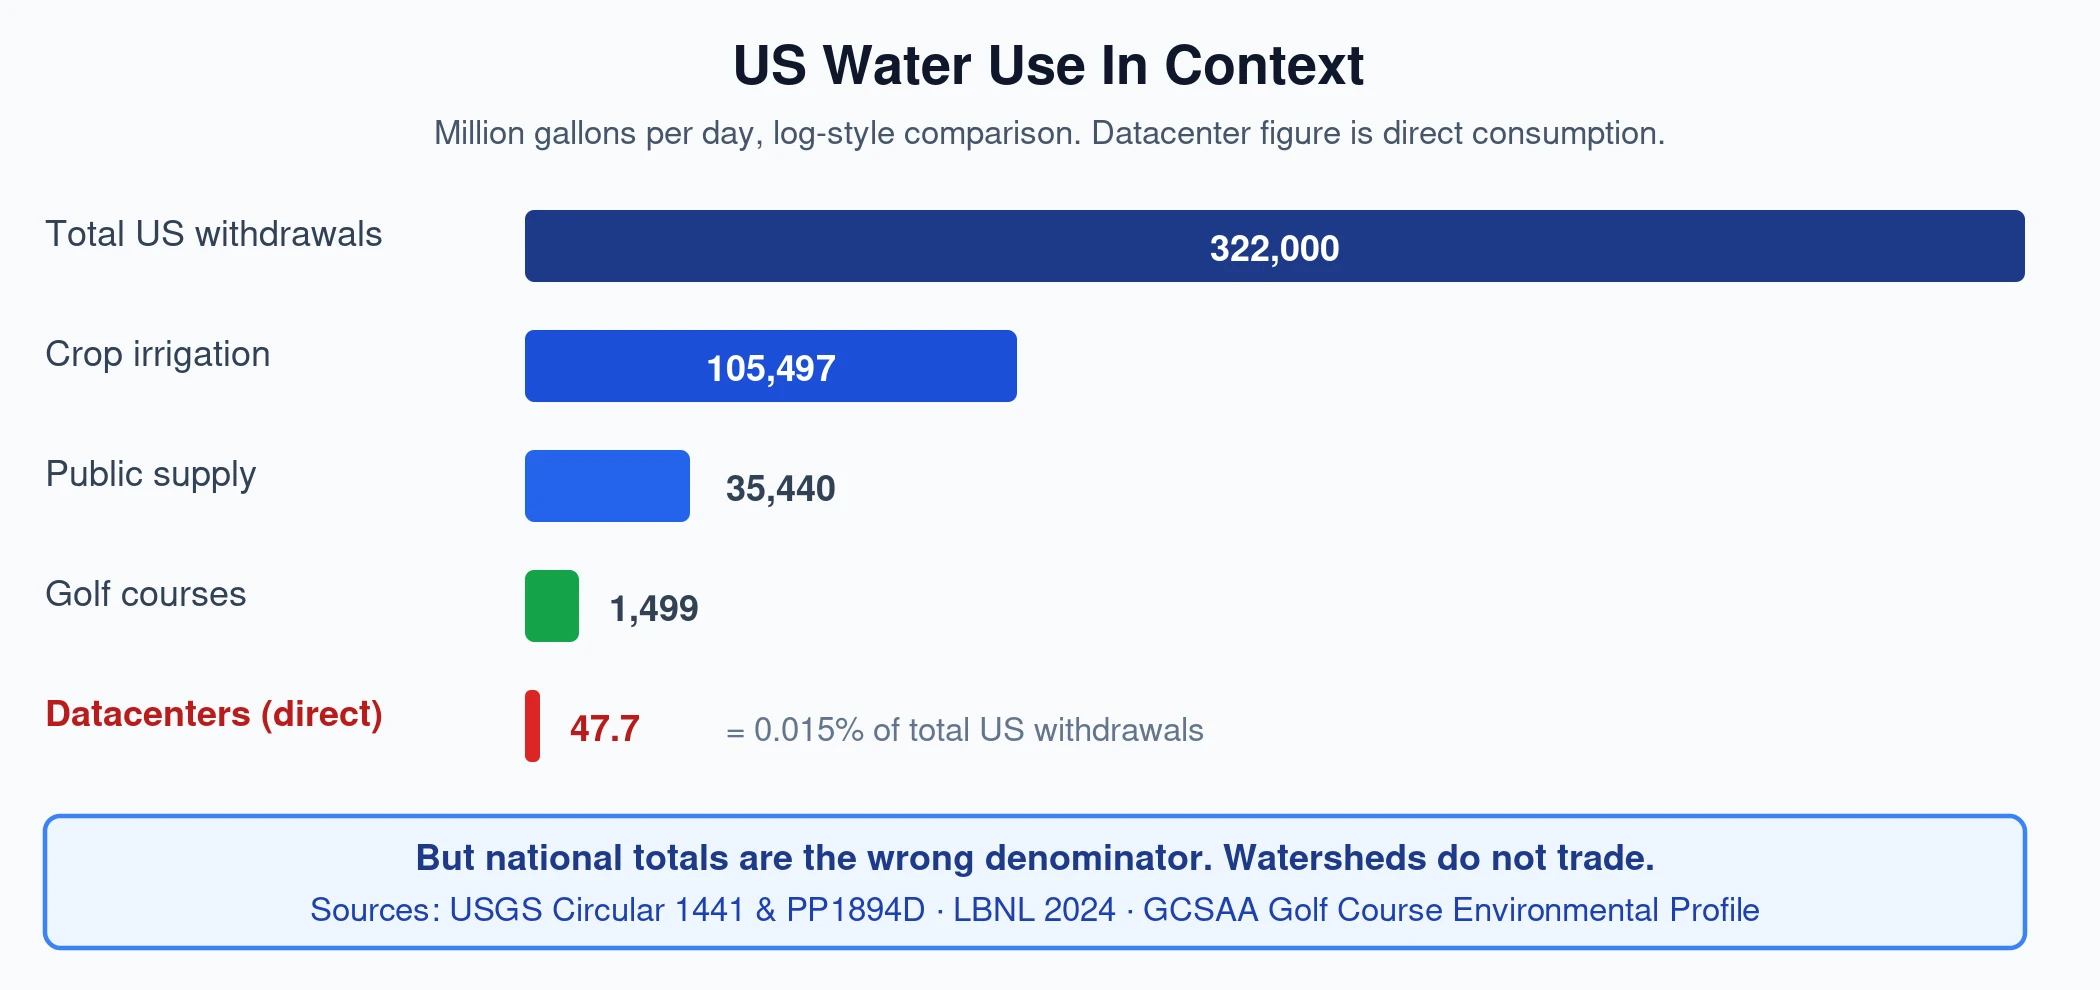
Now for the context that determines whether any of this should worry you.
LBNL's congressionally mandated 2024 report found US datacenters directly consumed 66 billion litres in 2023, up from 21.2 billion in 2014. That is about 47.7 million gallons per day.
Total US water withdrawals run about 322 billion gallons per day, per USGS Circular 1441.
Do the arithmetic and US datacenter direct water consumption is roughly 0.015% of national withdrawals. Including indirect power-generation water brings it to about 0.20%.
Some comparisons that put that in perspective:
Where The Real Problem Is: Local, Not Global
Everything above might read like the concern is overblown. That would be the wrong conclusion, and here is why.
Water does not behave like carbon. A tonne of CO2 has the same effect wherever it is emitted. A million gallons of water has a completely different meaning in Iceland than in Arizona. Watersheds do not trade.
So national percentages, including the 0.015% figure I just gave you, are close to meaningless for judging local harm. Here are the documented cases.
The Dalles, Oregon
This is the clearest case, partly because it started as a transparency fight.
In 2021, Google and the city of The Dalles argued the datacenter's water use was a trade secret. The city sued The Oregonian over a public records request, and Google funded the city's legal costs, over $100,000. In December 2022 the city dropped the suit and the records came out:
| Year | Million gallons |
|---|---|
| 2012 | 104.3 |
| 2016 | 113.1 |
| 2019 | 233.3 |
| 2021 | 355.1 = 29% of the entire city's water |
By 2024 that had grown to roughly one-third of city water, about a million gallons a day, according to OPB reporting in January 2026.
The city is now pursuing H.R. 655, a bill to acquire Mount Hood National Forest land and triple its reservoir capacity without Forest Service environmental review. Residential water rates are projected to rise 99% by 2036. Google's property taxes are discounted 92%, and the facility employs about 200 people.
John DeVoe of WaterWatch of Oregon put it directly:
"The notion that this water is somehow for drinking water for residents of the city, it's just a fallacy."
Memphis, Newton County, And Tucson
Memphis: xAI's Colossus facility bought over 25 million gallons from the local utility in March 2026, roughly 812,502 gallons per day drawn from the Memphis Sand Aquifer, and pays $0.19 per 100 gallons against $0.32 for regular customers. A $78 million water recycling plant designed to cut aquifer withdrawals by 9% had its construction paused in April 2026.
Newton County, Georgia: the New York Times reported in July 2025 that a couple living 1,000 feet from a Meta datacenter had their well fail. The county water authority director said Meta uses about 10% of county daily water. Meta commissioned a study and called its role "unlikely."
Tucson, Arizona: the city council voted 7-0 to reject the 290-acre "Project Blue" datacenter in August 2025 after secrecy and water concerns. The project later moved forward outside city limits.
The Siting Problem
This is the finding that ties the local cases together. Bloomberg's May 2025 analysis found that about two-thirds of datacenters built or in development since 2022 sit in high-water-stress areas. More than 160 new US AI datacenters landed in high-competition water regions, a 70% increase over the prior three years.
Ren's framing is the useful one: "Water is a hyperlocal resource."
Add the timescale mismatch. A datacenter takes two to three years to build. A new municipal water source can take twenty. Texas projects datacenter water demand of 29 to 161 billion gallons by 2030, and its State Water Plan contains no line item for datacenters and will not until at least 2032.
The Honest Counter-Argument
I want to give the other side properly, because some of it is strong and it changed how I read the headline numbers.
The indirect water figure is methodologically contested. Brian Potter at Construction Physics, who first corrected himself upward before revising down, points out that LBNL's 4.52 L/kWh figure counts hydroelectric reservoir evaporation at 18.27 gallons per kWh, which USGS excludes from its water accounting entirely. LBNL also excludes power purchase agreements, though hyperscalers buy overwhelmingly wind and solar. Potter's adjusted estimate is 200 to 275 million gallons per day rather than 628.
Headline claims have failed fact-checks. Karen Hao publicly corrected her book Empire of AI in December 2025 after a 1,000x unit error, litres versus cubic metres in a Chilean government document, made a comparison wildly wrong. The corrected ratio was 1.045x. She also changed "consume" to "use/withdraw" on a widely-cited projection.
Engineering already solves this where anyone insists. OpenAI's Abilene, Texas campus uses closed-loop cooling: about 8 million gallons for the one-time fill, then roughly 12,000 gallons per building per year. Its annual water use is about half of what Abilene uses in a single day. In Chile, Google switched its Cerrillos design to air-cooled condensers in 2022 after community pressure, eliminating the disputed groundwater draw entirely.
That last point is the one I keep coming back to. Datacenter water use is a design choice traded against energy, not a physical requirement. Where communities have pushed, designs have changed.
What I Actually Conclude
After going through all of this, here is where I land.
The per-query panic is overstated. Your individual ChatGPT use is not meaningfully draining anything, and the number people quote at you is wrong by roughly an order of magnitude. On a personal level, one kilogram of beef carries the water footprint of tens of thousands of AI queries.
The local siting problem is real and underrated. Two-thirds of new capacity going into water-stressed regions is a genuine planning failure, and The Dalles going from 12% to a third of a city's water supply is not a rounding error to the people who live there.
The transparency problem is the worst of the three. Not one company reports water attributable to AI. Consumption is calculated rather than metered. Only about 40% of operators collect water data at all, per Uptime Institute. Google fought a newspaper in court to keep one city's numbers secret. Every number in this article, including the ones I trust most, rests on modeling rather than metering.
Frequently Asked Questions (FAQs)
How much water does one ChatGPT query use?
Credible estimates range from about 0.26ml to 48ml, depending mainly on whether power-generation water is counted and where the datacenter sits. OpenAI's own claimed figure is 0.32ml, though it published no methodology. The viral "500ml per query" claim is a misread of a study that actually says 500ml per 10 to 50 responses.
Does AI use more water than it did before?
Yes, sharply. Google's water consumption grew 190% between 2020 and 2025, and Microsoft's rose 105% between FY20 and FY25. Both companies' own sustainability reports show the acceleration coinciding with the AI buildout.
Why do different studies give such different water numbers?
The biggest reason is scope. Ren et al. count both datacenter cooling water and the water evaporated at power plants generating the electricity, which makes up 87% of their total. Google counts only on-site cooling water. Location, model size, and assumed energy per query explain most of the rest.
Is AI water use a big deal compared to farming?
At national scale, no. US datacenters directly consume about 0.015% of total US withdrawals, and US golf courses use roughly 31 times more water. The concern is local concentration rather than national volume, since roughly two-thirds of new datacenters are being built in water-stressed regions.
Can datacenters run without using water?
Yes, using closed-loop or air-cooled designs. OpenAI's Abilene campus uses about 12,000 gallons per building per year after its initial fill, and Microsoft has announced a zero-water cooling design going live in late 2027. The tradeoff is that waterless cooling typically uses two to three times more electricity, and generating that electricity consumes water elsewhere.
Do OpenAI and Anthropic report their water use?
Barely. Anthropic publishes no sustainability report and no water figures at all. OpenAI's only public number is a single line in Sam Altman's personal blog post with no methodology behind it. Both rent capacity from cloud providers, so their water use sits inside Google, Microsoft and Amazon's reported totals.
Final Thoughts
The next time you see a water statistic about AI, check three things before you share it: whether it counts power-generation water, whether it says consumption or withdrawal, and which model generation it measures. Those three questions resolve most of the apparent contradictions in this debate.
My own view is that the individual-guilt framing is a distraction, and the siting and transparency questions are where the real leverage is. If you want to follow this properly, watch two things: whether Microsoft's zero-water datacenters actually ship in late 2027, and whether any company starts reporting water attributable to AI workloads specifically. Right now, not one of them does.